Menominee vs Tlingit-Haida Ambulatory Disability
COMPARE
Menominee
Tlingit-Haida
Ambulatory Disability
Ambulatory Disability Comparison
Menominee
Tlingit-Haida
7.8%
AMBULATORY DISABILITY
0.0/ 100
METRIC RATING
332nd/ 347
METRIC RANK
6.5%
AMBULATORY DISABILITY
1.5/ 100
METRIC RATING
245th/ 347
METRIC RANK
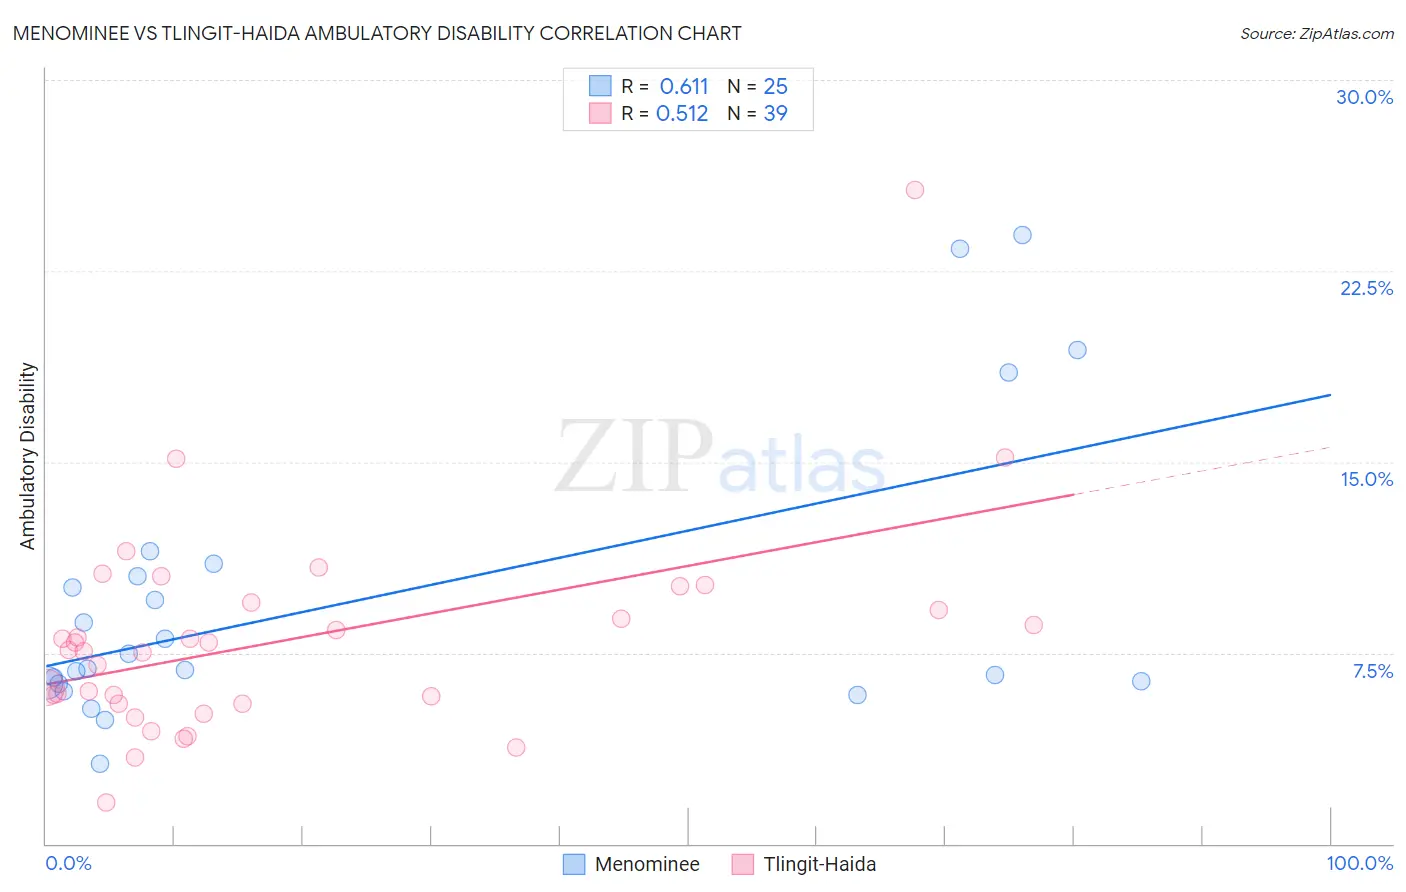
Menominee vs Tlingit-Haida Ambulatory Disability Correlation Chart
The statistical analysis conducted on geographies consisting of 45,777,730 people shows a significant positive correlation between the proportion of Menominee and percentage of population with ambulatory disability in the United States with a correlation coefficient (R) of 0.611 and weighted average of 7.8%. Similarly, the statistical analysis conducted on geographies consisting of 60,848,336 people shows a substantial positive correlation between the proportion of Tlingit-Haida and percentage of population with ambulatory disability in the United States with a correlation coefficient (R) of 0.512 and weighted average of 6.5%, a difference of 20.8%.
Ambulatory Disability Correlation Summary
| Measurement | Menominee | Tlingit-Haida |
| Minimum | 3.2% | 1.6% |
| Maximum | 23.9% | 25.7% |
| Range | 20.8% | 24.0% |
| Mean | 9.6% | 8.0% |
| Median | 6.9% | 7.6% |
| Interquartile 25% (IQ1) | 6.3% | 5.5% |
| Interquartile 75% (IQ3) | 10.8% | 9.5% |
| Interquartile Range (IQR) | 4.4% | 4.0% |
| Standard Deviation (Sample) | 5.7% | 4.1% |
| Standard Deviation (Population) | 5.5% | 4.1% |
Similar Demographics by Ambulatory Disability
Demographics Similar to Menominee by Ambulatory Disability
In terms of ambulatory disability, the demographic groups most similar to Menominee are Cajun (7.8%, a difference of 0.28%), Cherokee (7.9%, a difference of 0.89%), Paiute (7.7%, a difference of 1.5%), Yuman (7.9%, a difference of 1.8%), and Pueblo (7.6%, a difference of 2.7%).
| Demographics | Rating | Rank | Ambulatory Disability |
| Comanche | 0.0 /100 | #325 | Tragic 7.5% |
| Blacks/African Americans | 0.0 /100 | #326 | Tragic 7.5% |
| Natives/Alaskans | 0.0 /100 | #327 | Tragic 7.5% |
| Hopi | 0.0 /100 | #328 | Tragic 7.6% |
| Pueblo | 0.0 /100 | #329 | Tragic 7.6% |
| Paiute | 0.0 /100 | #330 | Tragic 7.7% |
| Cajuns | 0.0 /100 | #331 | Tragic 7.8% |
| Menominee | 0.0 /100 | #332 | Tragic 7.8% |
| Cherokee | 0.0 /100 | #333 | Tragic 7.9% |
| Yuman | 0.0 /100 | #334 | Tragic 7.9% |
| Chickasaw | 0.0 /100 | #335 | Tragic 8.0% |
| Seminole | 0.0 /100 | #336 | Tragic 8.0% |
| Dutch West Indians | 0.0 /100 | #337 | Tragic 8.2% |
| Colville | 0.0 /100 | #338 | Tragic 8.2% |
| Pima | 0.0 /100 | #339 | Tragic 8.2% |
Demographics Similar to Tlingit-Haida by Ambulatory Disability
In terms of ambulatory disability, the demographic groups most similar to Tlingit-Haida are Armenian (6.5%, a difference of 0.020%), Immigrants from Panama (6.5%, a difference of 0.030%), German (6.5%, a difference of 0.040%), Spaniard (6.5%, a difference of 0.060%), and Immigrants from Cuba (6.5%, a difference of 0.070%).
| Demographics | Rating | Rank | Ambulatory Disability |
| Haitians | 1.8 /100 | #238 | Tragic 6.4% |
| Senegalese | 1.7 /100 | #239 | Tragic 6.4% |
| Immigrants | Senegal | 1.7 /100 | #240 | Tragic 6.4% |
| Immigrants | Haiti | 1.6 /100 | #241 | Tragic 6.5% |
| Spaniards | 1.6 /100 | #242 | Tragic 6.5% |
| Germans | 1.5 /100 | #243 | Tragic 6.5% |
| Immigrants | Panama | 1.5 /100 | #244 | Tragic 6.5% |
| Tlingit-Haida | 1.5 /100 | #245 | Tragic 6.5% |
| Armenians | 1.5 /100 | #246 | Tragic 6.5% |
| Immigrants | Cuba | 1.4 /100 | #247 | Tragic 6.5% |
| Immigrants | Portugal | 1.4 /100 | #248 | Tragic 6.5% |
| Native Hawaiians | 1.1 /100 | #249 | Tragic 6.5% |
| Chinese | 1.0 /100 | #250 | Tragic 6.5% |
| Hawaiians | 0.9 /100 | #251 | Tragic 6.5% |
| Immigrants | Bahamas | 0.8 /100 | #252 | Tragic 6.5% |