Menominee vs Immigrants from Northern Europe Ambulatory Disability
COMPARE
Menominee
Immigrants from Northern Europe
Ambulatory Disability
Ambulatory Disability Comparison
Menominee
Immigrants from Northern Europe
7.8%
AMBULATORY DISABILITY
0.0/ 100
METRIC RATING
332nd/ 347
METRIC RANK
5.8%
AMBULATORY DISABILITY
98.2/ 100
METRIC RATING
99th/ 347
METRIC RANK
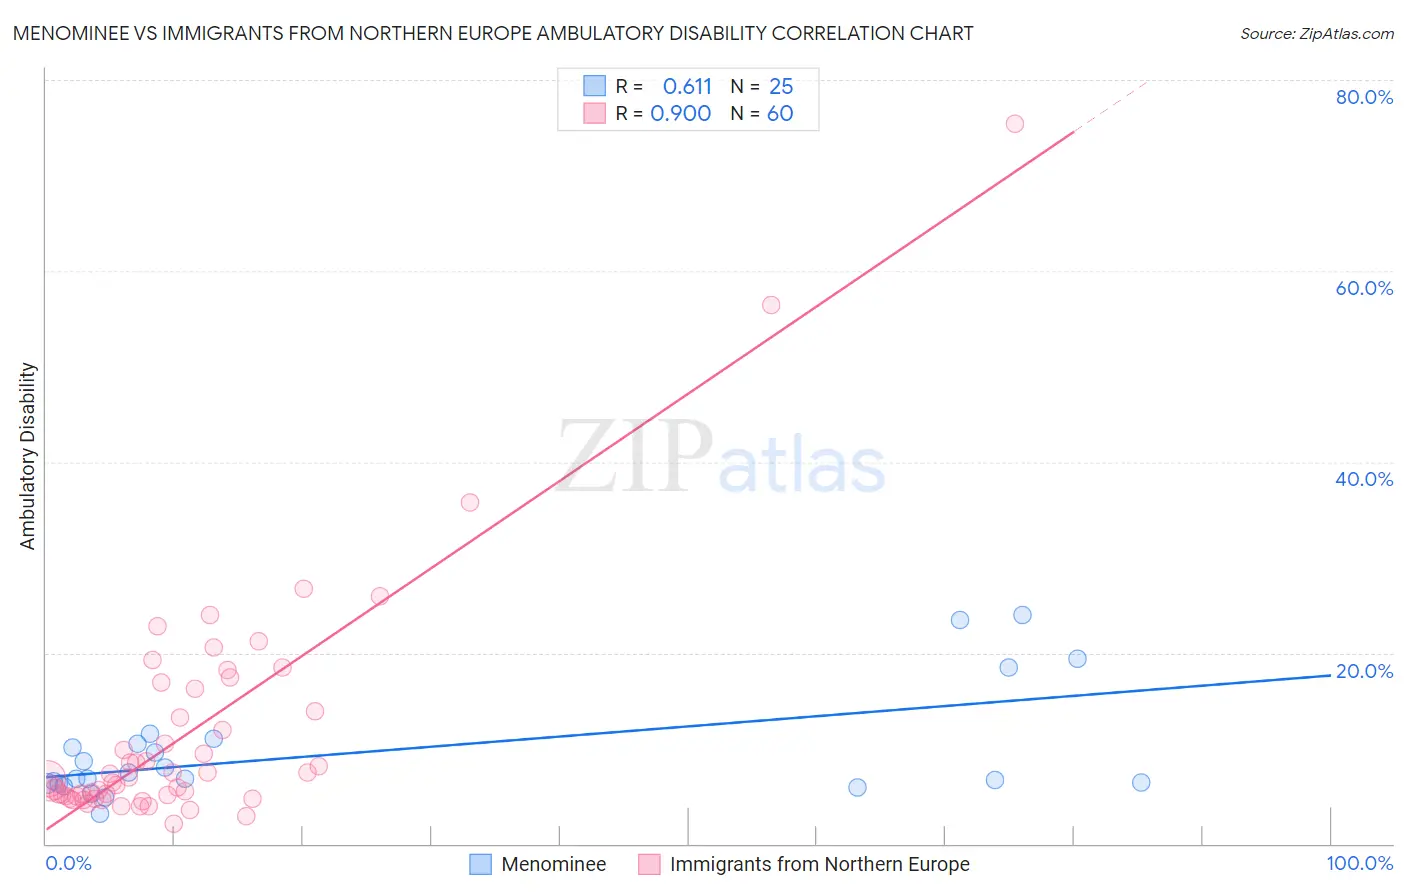
Menominee vs Immigrants from Northern Europe Ambulatory Disability Correlation Chart
The statistical analysis conducted on geographies consisting of 45,777,730 people shows a significant positive correlation between the proportion of Menominee and percentage of population with ambulatory disability in the United States with a correlation coefficient (R) of 0.611 and weighted average of 7.8%. Similarly, the statistical analysis conducted on geographies consisting of 477,075,376 people shows a very strong positive correlation between the proportion of Immigrants from Northern Europe and percentage of population with ambulatory disability in the United States with a correlation coefficient (R) of 0.900 and weighted average of 5.8%, a difference of 34.7%.
Ambulatory Disability Correlation Summary
| Measurement | Menominee | Immigrants from Northern Europe |
| Minimum | 3.2% | 2.1% |
| Maximum | 23.9% | 75.4% |
| Range | 20.8% | 73.3% |
| Mean | 9.6% | 11.7% |
| Median | 6.9% | 6.9% |
| Interquartile 25% (IQ1) | 6.3% | 5.0% |
| Interquartile 75% (IQ3) | 10.8% | 15.1% |
| Interquartile Range (IQR) | 4.4% | 10.1% |
| Standard Deviation (Sample) | 5.7% | 12.6% |
| Standard Deviation (Population) | 5.5% | 12.5% |
Similar Demographics by Ambulatory Disability
Demographics Similar to Menominee by Ambulatory Disability
In terms of ambulatory disability, the demographic groups most similar to Menominee are Cajun (7.8%, a difference of 0.28%), Cherokee (7.9%, a difference of 0.89%), Paiute (7.7%, a difference of 1.5%), Yuman (7.9%, a difference of 1.8%), and Pueblo (7.6%, a difference of 2.7%).
| Demographics | Rating | Rank | Ambulatory Disability |
| Comanche | 0.0 /100 | #325 | Tragic 7.5% |
| Blacks/African Americans | 0.0 /100 | #326 | Tragic 7.5% |
| Natives/Alaskans | 0.0 /100 | #327 | Tragic 7.5% |
| Hopi | 0.0 /100 | #328 | Tragic 7.6% |
| Pueblo | 0.0 /100 | #329 | Tragic 7.6% |
| Paiute | 0.0 /100 | #330 | Tragic 7.7% |
| Cajuns | 0.0 /100 | #331 | Tragic 7.8% |
| Menominee | 0.0 /100 | #332 | Tragic 7.8% |
| Cherokee | 0.0 /100 | #333 | Tragic 7.9% |
| Yuman | 0.0 /100 | #334 | Tragic 7.9% |
| Chickasaw | 0.0 /100 | #335 | Tragic 8.0% |
| Seminole | 0.0 /100 | #336 | Tragic 8.0% |
| Dutch West Indians | 0.0 /100 | #337 | Tragic 8.2% |
| Colville | 0.0 /100 | #338 | Tragic 8.2% |
| Pima | 0.0 /100 | #339 | Tragic 8.2% |
Demographics Similar to Immigrants from Northern Europe by Ambulatory Disability
In terms of ambulatory disability, the demographic groups most similar to Immigrants from Northern Europe are Immigrants from Lebanon (5.8%, a difference of 0.090%), Immigrants from Somalia (5.8%, a difference of 0.11%), Salvadoran (5.8%, a difference of 0.15%), Immigrants from El Salvador (5.8%, a difference of 0.17%), and Immigrants from Serbia (5.8%, a difference of 0.19%).
| Demographics | Rating | Rank | Ambulatory Disability |
| Immigrants | Sierra Leone | 98.6 /100 | #92 | Exceptional 5.8% |
| Immigrants | Denmark | 98.6 /100 | #93 | Exceptional 5.8% |
| Kenyans | 98.4 /100 | #94 | Exceptional 5.8% |
| Immigrants | El Salvador | 98.4 /100 | #95 | Exceptional 5.8% |
| Salvadorans | 98.4 /100 | #96 | Exceptional 5.8% |
| Immigrants | Somalia | 98.3 /100 | #97 | Exceptional 5.8% |
| Immigrants | Lebanon | 98.3 /100 | #98 | Exceptional 5.8% |
| Immigrants | Northern Europe | 98.2 /100 | #99 | Exceptional 5.8% |
| Immigrants | Serbia | 97.9 /100 | #100 | Exceptional 5.8% |
| Immigrants | South America | 97.9 /100 | #101 | Exceptional 5.8% |
| Immigrants | Kenya | 97.8 /100 | #102 | Exceptional 5.8% |
| Immigrants | Romania | 97.7 /100 | #103 | Exceptional 5.8% |
| New Zealanders | 97.6 /100 | #104 | Exceptional 5.8% |
| Immigrants | Czechoslovakia | 97.4 /100 | #105 | Exceptional 5.8% |
| Immigrants | Morocco | 97.3 /100 | #106 | Exceptional 5.8% |