Malaysian vs Tlingit-Haida Ambulatory Disability
COMPARE
Malaysian
Tlingit-Haida
Ambulatory Disability
Ambulatory Disability Comparison
Malaysians
Tlingit-Haida
6.2%
AMBULATORY DISABILITY
28.2/ 100
METRIC RATING
196th/ 347
METRIC RANK
6.5%
AMBULATORY DISABILITY
1.5/ 100
METRIC RATING
245th/ 347
METRIC RANK
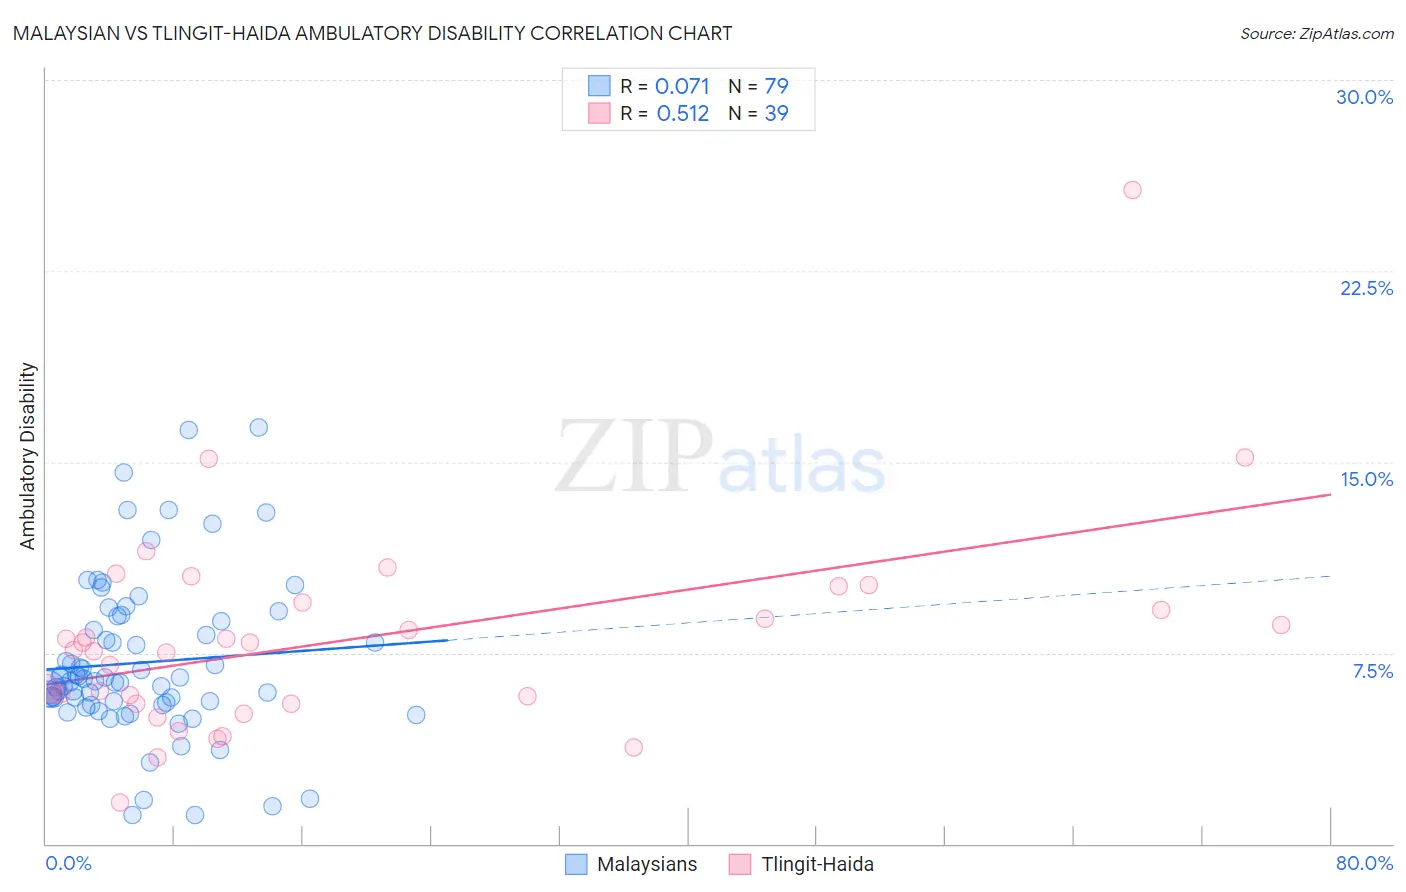
Malaysian vs Tlingit-Haida Ambulatory Disability Correlation Chart
The statistical analysis conducted on geographies consisting of 226,050,790 people shows a slight positive correlation between the proportion of Malaysians and percentage of population with ambulatory disability in the United States with a correlation coefficient (R) of 0.071 and weighted average of 6.2%. Similarly, the statistical analysis conducted on geographies consisting of 60,848,336 people shows a substantial positive correlation between the proportion of Tlingit-Haida and percentage of population with ambulatory disability in the United States with a correlation coefficient (R) of 0.512 and weighted average of 6.5%, a difference of 4.3%.
Ambulatory Disability Correlation Summary
| Measurement | Malaysian | Tlingit-Haida |
| Minimum | 1.1% | 1.6% |
| Maximum | 16.3% | 25.7% |
| Range | 15.2% | 24.0% |
| Mean | 7.1% | 8.0% |
| Median | 6.4% | 7.6% |
| Interquartile 25% (IQ1) | 5.6% | 5.5% |
| Interquartile 75% (IQ3) | 8.8% | 9.5% |
| Interquartile Range (IQR) | 3.2% | 4.0% |
| Standard Deviation (Sample) | 3.1% | 4.1% |
| Standard Deviation (Population) | 3.1% | 4.1% |
Similar Demographics by Ambulatory Disability
Demographics Similar to Malaysians by Ambulatory Disability
In terms of ambulatory disability, the demographic groups most similar to Malaysians are Belgian (6.2%, a difference of 0.030%), Alaska Native (6.2%, a difference of 0.10%), Guatemalan (6.2%, a difference of 0.11%), Polish (6.2%, a difference of 0.12%), and Immigrants from Western Europe (6.2%, a difference of 0.21%).
| Demographics | Rating | Rank | Ambulatory Disability |
| Ukrainians | 34.0 /100 | #189 | Fair 6.2% |
| Immigrants | Western Africa | 33.4 /100 | #190 | Fair 6.2% |
| Immigrants | Guatemala | 31.9 /100 | #191 | Fair 6.2% |
| Immigrants | Western Europe | 31.6 /100 | #192 | Fair 6.2% |
| Guatemalans | 30.0 /100 | #193 | Fair 6.2% |
| Alaska Natives | 29.8 /100 | #194 | Fair 6.2% |
| Belgians | 28.6 /100 | #195 | Fair 6.2% |
| Malaysians | 28.2 /100 | #196 | Fair 6.2% |
| Poles | 26.3 /100 | #197 | Fair 6.2% |
| Immigrants | Bangladesh | 24.6 /100 | #198 | Fair 6.2% |
| Italians | 22.6 /100 | #199 | Fair 6.2% |
| Immigrants | Cambodia | 21.5 /100 | #200 | Fair 6.2% |
| Immigrants | Central America | 20.1 /100 | #201 | Fair 6.2% |
| Albanians | 19.7 /100 | #202 | Poor 6.2% |
| Immigrants | Ukraine | 18.4 /100 | #203 | Poor 6.2% |
Demographics Similar to Tlingit-Haida by Ambulatory Disability
In terms of ambulatory disability, the demographic groups most similar to Tlingit-Haida are Armenian (6.5%, a difference of 0.020%), Immigrants from Panama (6.5%, a difference of 0.030%), German (6.5%, a difference of 0.040%), Spaniard (6.5%, a difference of 0.060%), and Immigrants from Cuba (6.5%, a difference of 0.070%).
| Demographics | Rating | Rank | Ambulatory Disability |
| Haitians | 1.8 /100 | #238 | Tragic 6.4% |
| Senegalese | 1.7 /100 | #239 | Tragic 6.4% |
| Immigrants | Senegal | 1.7 /100 | #240 | Tragic 6.4% |
| Immigrants | Haiti | 1.6 /100 | #241 | Tragic 6.5% |
| Spaniards | 1.6 /100 | #242 | Tragic 6.5% |
| Germans | 1.5 /100 | #243 | Tragic 6.5% |
| Immigrants | Panama | 1.5 /100 | #244 | Tragic 6.5% |
| Tlingit-Haida | 1.5 /100 | #245 | Tragic 6.5% |
| Armenians | 1.5 /100 | #246 | Tragic 6.5% |
| Immigrants | Cuba | 1.4 /100 | #247 | Tragic 6.5% |
| Immigrants | Portugal | 1.4 /100 | #248 | Tragic 6.5% |
| Native Hawaiians | 1.1 /100 | #249 | Tragic 6.5% |
| Chinese | 1.0 /100 | #250 | Tragic 6.5% |
| Hawaiians | 0.9 /100 | #251 | Tragic 6.5% |
| Immigrants | Bahamas | 0.8 /100 | #252 | Tragic 6.5% |