Serbian vs Tlingit-Haida Ambulatory Disability
COMPARE
Serbian
Tlingit-Haida
Ambulatory Disability
Ambulatory Disability Comparison
Serbians
Tlingit-Haida
6.1%
AMBULATORY DISABILITY
42.8/ 100
METRIC RATING
182nd/ 347
METRIC RANK
6.5%
AMBULATORY DISABILITY
1.5/ 100
METRIC RATING
245th/ 347
METRIC RANK
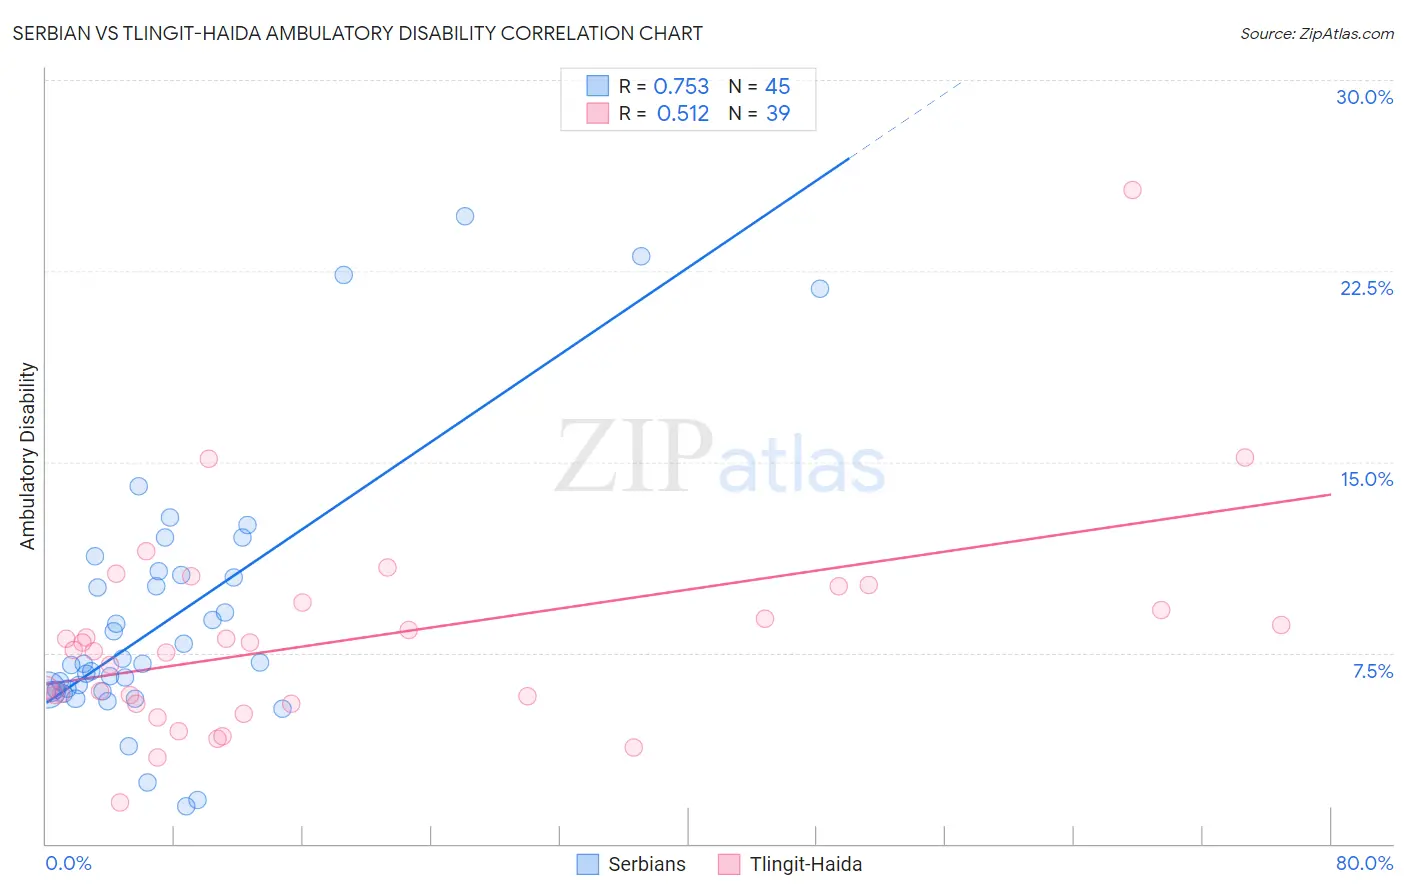
Serbian vs Tlingit-Haida Ambulatory Disability Correlation Chart
The statistical analysis conducted on geographies consisting of 267,596,356 people shows a strong positive correlation between the proportion of Serbians and percentage of population with ambulatory disability in the United States with a correlation coefficient (R) of 0.753 and weighted average of 6.1%. Similarly, the statistical analysis conducted on geographies consisting of 60,848,336 people shows a substantial positive correlation between the proportion of Tlingit-Haida and percentage of population with ambulatory disability in the United States with a correlation coefficient (R) of 0.512 and weighted average of 6.5%, a difference of 5.1%.
Ambulatory Disability Correlation Summary
| Measurement | Serbian | Tlingit-Haida |
| Minimum | 1.5% | 1.6% |
| Maximum | 24.6% | 25.7% |
| Range | 23.2% | 24.0% |
| Mean | 9.0% | 8.0% |
| Median | 7.1% | 7.6% |
| Interquartile 25% (IQ1) | 6.0% | 5.5% |
| Interquartile 75% (IQ3) | 10.6% | 9.5% |
| Interquartile Range (IQR) | 4.6% | 4.0% |
| Standard Deviation (Sample) | 5.2% | 4.1% |
| Standard Deviation (Population) | 5.2% | 4.1% |
Similar Demographics by Ambulatory Disability
Demographics Similar to Serbians by Ambulatory Disability
In terms of ambulatory disability, the demographic groups most similar to Serbians are Swiss (6.1%, a difference of 0.010%), Immigrants from Thailand (6.1%, a difference of 0.030%), Immigrants from Nicaragua (6.1%, a difference of 0.060%), Austrian (6.1%, a difference of 0.070%), and Scandinavian (6.1%, a difference of 0.090%).
| Demographics | Rating | Rank | Ambulatory Disability |
| Vietnamese | 47.2 /100 | #175 | Average 6.1% |
| Immigrants | North America | 45.6 /100 | #176 | Average 6.1% |
| Immigrants | England | 45.4 /100 | #177 | Average 6.1% |
| Scandinavians | 44.5 /100 | #178 | Average 6.1% |
| Austrians | 44.1 /100 | #179 | Average 6.1% |
| Immigrants | Nicaragua | 43.9 /100 | #180 | Average 6.1% |
| Swiss | 43.1 /100 | #181 | Average 6.1% |
| Serbians | 42.8 /100 | #182 | Average 6.1% |
| Immigrants | Thailand | 42.2 /100 | #183 | Average 6.1% |
| Immigrants | Ghana | 41.2 /100 | #184 | Average 6.1% |
| Immigrants | Bosnia and Herzegovina | 37.2 /100 | #185 | Fair 6.2% |
| Europeans | 36.2 /100 | #186 | Fair 6.2% |
| Carpatho Rusyns | 35.3 /100 | #187 | Fair 6.2% |
| British | 34.3 /100 | #188 | Fair 6.2% |
| Ukrainians | 34.0 /100 | #189 | Fair 6.2% |
Demographics Similar to Tlingit-Haida by Ambulatory Disability
In terms of ambulatory disability, the demographic groups most similar to Tlingit-Haida are Armenian (6.5%, a difference of 0.020%), Immigrants from Panama (6.5%, a difference of 0.030%), German (6.5%, a difference of 0.040%), Spaniard (6.5%, a difference of 0.060%), and Immigrants from Cuba (6.5%, a difference of 0.070%).
| Demographics | Rating | Rank | Ambulatory Disability |
| Haitians | 1.8 /100 | #238 | Tragic 6.4% |
| Senegalese | 1.7 /100 | #239 | Tragic 6.4% |
| Immigrants | Senegal | 1.7 /100 | #240 | Tragic 6.4% |
| Immigrants | Haiti | 1.6 /100 | #241 | Tragic 6.5% |
| Spaniards | 1.6 /100 | #242 | Tragic 6.5% |
| Germans | 1.5 /100 | #243 | Tragic 6.5% |
| Immigrants | Panama | 1.5 /100 | #244 | Tragic 6.5% |
| Tlingit-Haida | 1.5 /100 | #245 | Tragic 6.5% |
| Armenians | 1.5 /100 | #246 | Tragic 6.5% |
| Immigrants | Cuba | 1.4 /100 | #247 | Tragic 6.5% |
| Immigrants | Portugal | 1.4 /100 | #248 | Tragic 6.5% |
| Native Hawaiians | 1.1 /100 | #249 | Tragic 6.5% |
| Chinese | 1.0 /100 | #250 | Tragic 6.5% |
| Hawaiians | 0.9 /100 | #251 | Tragic 6.5% |
| Immigrants | Bahamas | 0.8 /100 | #252 | Tragic 6.5% |