Bangladeshi vs Tlingit-Haida Ambulatory Disability
COMPARE
Bangladeshi
Tlingit-Haida
Ambulatory Disability
Ambulatory Disability Comparison
Bangladeshis
Tlingit-Haida
6.3%
AMBULATORY DISABILITY
14.2/ 100
METRIC RATING
208th/ 347
METRIC RANK
6.5%
AMBULATORY DISABILITY
1.5/ 100
METRIC RATING
245th/ 347
METRIC RANK
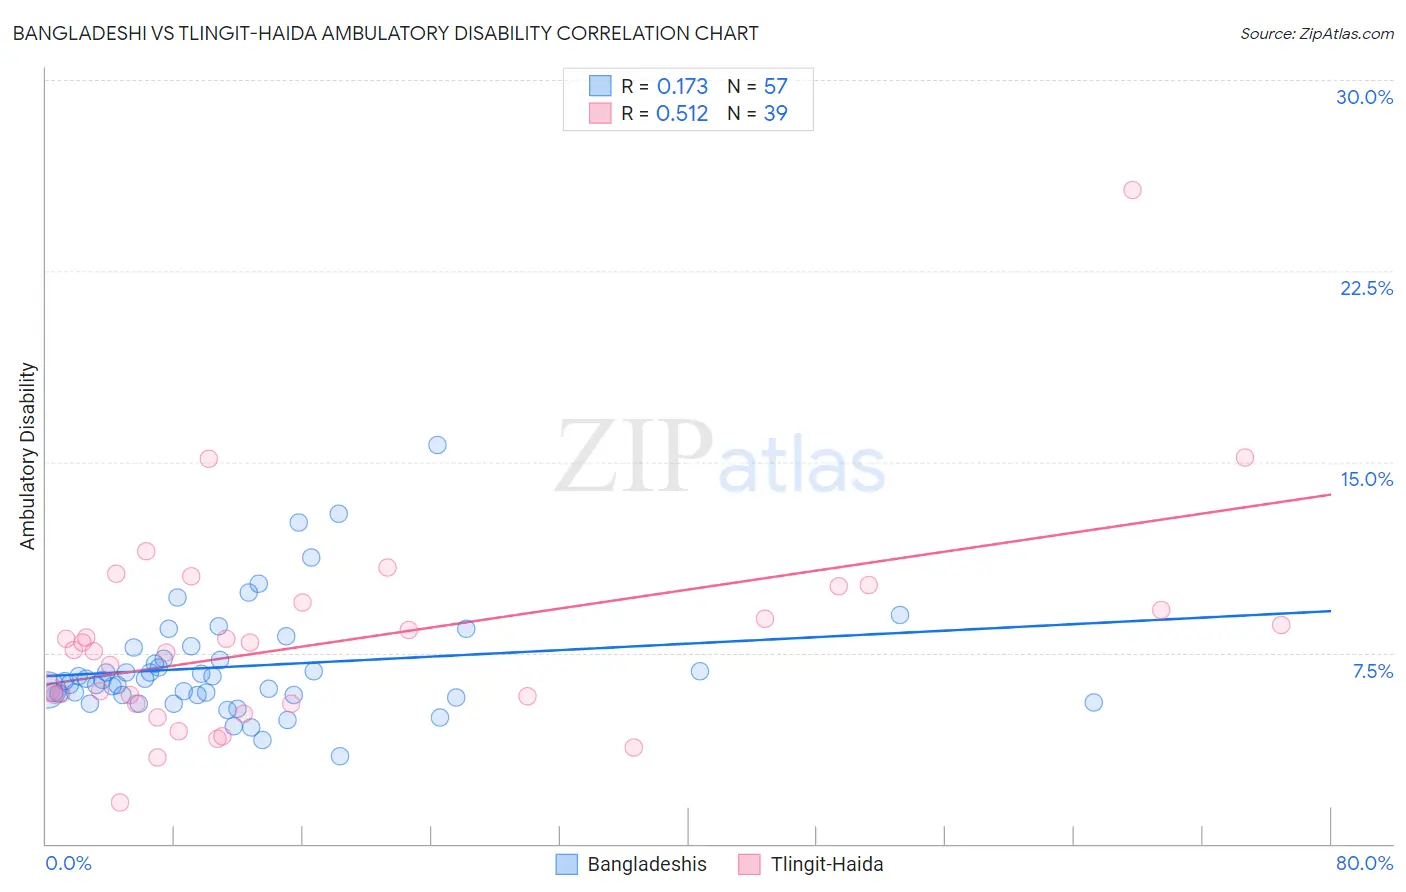
Bangladeshi vs Tlingit-Haida Ambulatory Disability Correlation Chart
The statistical analysis conducted on geographies consisting of 141,368,014 people shows a poor positive correlation between the proportion of Bangladeshis and percentage of population with ambulatory disability in the United States with a correlation coefficient (R) of 0.173 and weighted average of 6.3%. Similarly, the statistical analysis conducted on geographies consisting of 60,848,336 people shows a substantial positive correlation between the proportion of Tlingit-Haida and percentage of population with ambulatory disability in the United States with a correlation coefficient (R) of 0.512 and weighted average of 6.5%, a difference of 3.1%.
Ambulatory Disability Correlation Summary
| Measurement | Bangladeshi | Tlingit-Haida |
| Minimum | 3.4% | 1.6% |
| Maximum | 15.6% | 25.7% |
| Range | 12.2% | 24.0% |
| Mean | 7.0% | 8.0% |
| Median | 6.5% | 7.6% |
| Interquartile 25% (IQ1) | 5.8% | 5.5% |
| Interquartile 75% (IQ3) | 7.5% | 9.5% |
| Interquartile Range (IQR) | 1.6% | 4.0% |
| Standard Deviation (Sample) | 2.2% | 4.1% |
| Standard Deviation (Population) | 2.2% | 4.1% |
Similar Demographics by Ambulatory Disability
Demographics Similar to Bangladeshis by Ambulatory Disability
In terms of ambulatory disability, the demographic groups most similar to Bangladeshis are Immigrants from Iraq (6.3%, a difference of 0.020%), Alsatian (6.3%, a difference of 0.090%), Immigrants from Laos (6.3%, a difference of 0.10%), Samoan (6.3%, a difference of 0.24%), and Mexican American Indian (6.3%, a difference of 0.25%).
| Demographics | Rating | Rank | Ambulatory Disability |
| Immigrants | Central America | 20.1 /100 | #201 | Fair 6.2% |
| Albanians | 19.7 /100 | #202 | Poor 6.2% |
| Immigrants | Ukraine | 18.4 /100 | #203 | Poor 6.2% |
| Immigrants | Congo | 18.2 /100 | #204 | Poor 6.2% |
| Slovenes | 18.0 /100 | #205 | Poor 6.2% |
| Finns | 17.2 /100 | #206 | Poor 6.2% |
| Alsatians | 15.1 /100 | #207 | Poor 6.3% |
| Bangladeshis | 14.2 /100 | #208 | Poor 6.3% |
| Immigrants | Iraq | 14.0 /100 | #209 | Poor 6.3% |
| Immigrants | Laos | 13.2 /100 | #210 | Poor 6.3% |
| Samoans | 12.1 /100 | #211 | Poor 6.3% |
| Mexican American Indians | 12.0 /100 | #212 | Poor 6.3% |
| Japanese | 12.0 /100 | #213 | Poor 6.3% |
| Immigrants | Mexico | 11.0 /100 | #214 | Poor 6.3% |
| Immigrants | Latin America | 11.0 /100 | #215 | Poor 6.3% |
Demographics Similar to Tlingit-Haida by Ambulatory Disability
In terms of ambulatory disability, the demographic groups most similar to Tlingit-Haida are Armenian (6.5%, a difference of 0.020%), Immigrants from Panama (6.5%, a difference of 0.030%), German (6.5%, a difference of 0.040%), Spaniard (6.5%, a difference of 0.060%), and Immigrants from Cuba (6.5%, a difference of 0.070%).
| Demographics | Rating | Rank | Ambulatory Disability |
| Haitians | 1.8 /100 | #238 | Tragic 6.4% |
| Senegalese | 1.7 /100 | #239 | Tragic 6.4% |
| Immigrants | Senegal | 1.7 /100 | #240 | Tragic 6.4% |
| Immigrants | Haiti | 1.6 /100 | #241 | Tragic 6.5% |
| Spaniards | 1.6 /100 | #242 | Tragic 6.5% |
| Germans | 1.5 /100 | #243 | Tragic 6.5% |
| Immigrants | Panama | 1.5 /100 | #244 | Tragic 6.5% |
| Tlingit-Haida | 1.5 /100 | #245 | Tragic 6.5% |
| Armenians | 1.5 /100 | #246 | Tragic 6.5% |
| Immigrants | Cuba | 1.4 /100 | #247 | Tragic 6.5% |
| Immigrants | Portugal | 1.4 /100 | #248 | Tragic 6.5% |
| Native Hawaiians | 1.1 /100 | #249 | Tragic 6.5% |
| Chinese | 1.0 /100 | #250 | Tragic 6.5% |
| Hawaiians | 0.9 /100 | #251 | Tragic 6.5% |
| Immigrants | Bahamas | 0.8 /100 | #252 | Tragic 6.5% |