Menominee vs Immigrants from Belgium Ambulatory Disability
COMPARE
Menominee
Immigrants from Belgium
Ambulatory Disability
Ambulatory Disability Comparison
Menominee
Immigrants from Belgium
7.8%
AMBULATORY DISABILITY
0.0/ 100
METRIC RATING
332nd/ 347
METRIC RANK
5.6%
AMBULATORY DISABILITY
99.7/ 100
METRIC RATING
61st/ 347
METRIC RANK
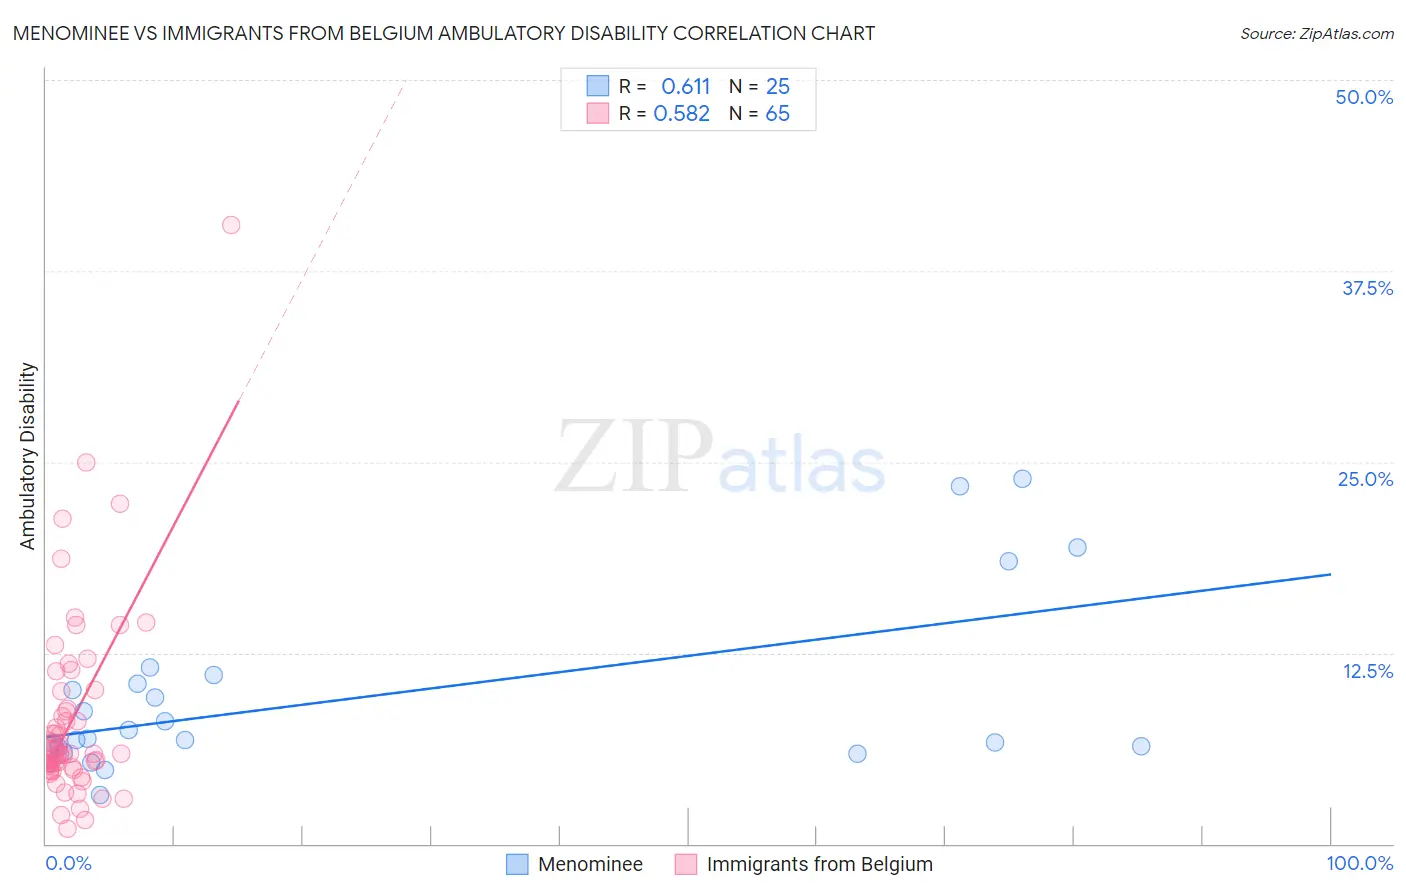
Menominee vs Immigrants from Belgium Ambulatory Disability Correlation Chart
The statistical analysis conducted on geographies consisting of 45,777,730 people shows a significant positive correlation between the proportion of Menominee and percentage of population with ambulatory disability in the United States with a correlation coefficient (R) of 0.611 and weighted average of 7.8%. Similarly, the statistical analysis conducted on geographies consisting of 146,707,151 people shows a substantial positive correlation between the proportion of Immigrants from Belgium and percentage of population with ambulatory disability in the United States with a correlation coefficient (R) of 0.582 and weighted average of 5.6%, a difference of 38.4%.
Ambulatory Disability Correlation Summary
| Measurement | Menominee | Immigrants from Belgium |
| Minimum | 3.2% | 0.96% |
| Maximum | 23.9% | 40.5% |
| Range | 20.8% | 39.5% |
| Mean | 9.6% | 8.1% |
| Median | 6.9% | 5.9% |
| Interquartile 25% (IQ1) | 6.3% | 4.9% |
| Interquartile 75% (IQ3) | 10.8% | 9.4% |
| Interquartile Range (IQR) | 4.4% | 4.5% |
| Standard Deviation (Sample) | 5.7% | 6.3% |
| Standard Deviation (Population) | 5.5% | 6.3% |
Similar Demographics by Ambulatory Disability
Demographics Similar to Menominee by Ambulatory Disability
In terms of ambulatory disability, the demographic groups most similar to Menominee are Cajun (7.8%, a difference of 0.28%), Cherokee (7.9%, a difference of 0.89%), Paiute (7.7%, a difference of 1.5%), Yuman (7.9%, a difference of 1.8%), and Pueblo (7.6%, a difference of 2.7%).
| Demographics | Rating | Rank | Ambulatory Disability |
| Comanche | 0.0 /100 | #325 | Tragic 7.5% |
| Blacks/African Americans | 0.0 /100 | #326 | Tragic 7.5% |
| Natives/Alaskans | 0.0 /100 | #327 | Tragic 7.5% |
| Hopi | 0.0 /100 | #328 | Tragic 7.6% |
| Pueblo | 0.0 /100 | #329 | Tragic 7.6% |
| Paiute | 0.0 /100 | #330 | Tragic 7.7% |
| Cajuns | 0.0 /100 | #331 | Tragic 7.8% |
| Menominee | 0.0 /100 | #332 | Tragic 7.8% |
| Cherokee | 0.0 /100 | #333 | Tragic 7.9% |
| Yuman | 0.0 /100 | #334 | Tragic 7.9% |
| Chickasaw | 0.0 /100 | #335 | Tragic 8.0% |
| Seminole | 0.0 /100 | #336 | Tragic 8.0% |
| Dutch West Indians | 0.0 /100 | #337 | Tragic 8.2% |
| Colville | 0.0 /100 | #338 | Tragic 8.2% |
| Pima | 0.0 /100 | #339 | Tragic 8.2% |
Demographics Similar to Immigrants from Belgium by Ambulatory Disability
In terms of ambulatory disability, the demographic groups most similar to Immigrants from Belgium are Immigrants from Spain (5.6%, a difference of 0.010%), Immigrants from Lithuania (5.6%, a difference of 0.12%), Immigrants from France (5.6%, a difference of 0.13%), Immigrants from Afghanistan (5.6%, a difference of 0.16%), and Immigrants from Zimbabwe (5.6%, a difference of 0.20%).
| Demographics | Rating | Rank | Ambulatory Disability |
| Immigrants | Eastern Africa | 99.8 /100 | #54 | Exceptional 5.6% |
| Immigrants | Bulgaria | 99.8 /100 | #55 | Exceptional 5.6% |
| Inupiat | 99.8 /100 | #56 | Exceptional 5.6% |
| Immigrants | Brazil | 99.8 /100 | #57 | Exceptional 5.6% |
| Immigrants | Zimbabwe | 99.8 /100 | #58 | Exceptional 5.6% |
| Immigrants | Afghanistan | 99.8 /100 | #59 | Exceptional 5.6% |
| Immigrants | Lithuania | 99.8 /100 | #60 | Exceptional 5.6% |
| Immigrants | Belgium | 99.7 /100 | #61 | Exceptional 5.6% |
| Immigrants | Spain | 99.7 /100 | #62 | Exceptional 5.6% |
| Immigrants | France | 99.7 /100 | #63 | Exceptional 5.6% |
| Laotians | 99.7 /100 | #64 | Exceptional 5.7% |
| Immigrants | Switzerland | 99.7 /100 | #65 | Exceptional 5.7% |
| Israelis | 99.6 /100 | #66 | Exceptional 5.7% |
| Immigrants | Uganda | 99.6 /100 | #67 | Exceptional 5.7% |
| Sri Lankans | 99.6 /100 | #68 | Exceptional 5.7% |