Menominee vs Immigrants from Malaysia Ambulatory Disability
COMPARE
Menominee
Immigrants from Malaysia
Ambulatory Disability
Ambulatory Disability Comparison
Menominee
Immigrants from Malaysia
7.8%
AMBULATORY DISABILITY
0.0/ 100
METRIC RATING
332nd/ 347
METRIC RANK
5.5%
AMBULATORY DISABILITY
100.0/ 100
METRIC RATING
36th/ 347
METRIC RANK
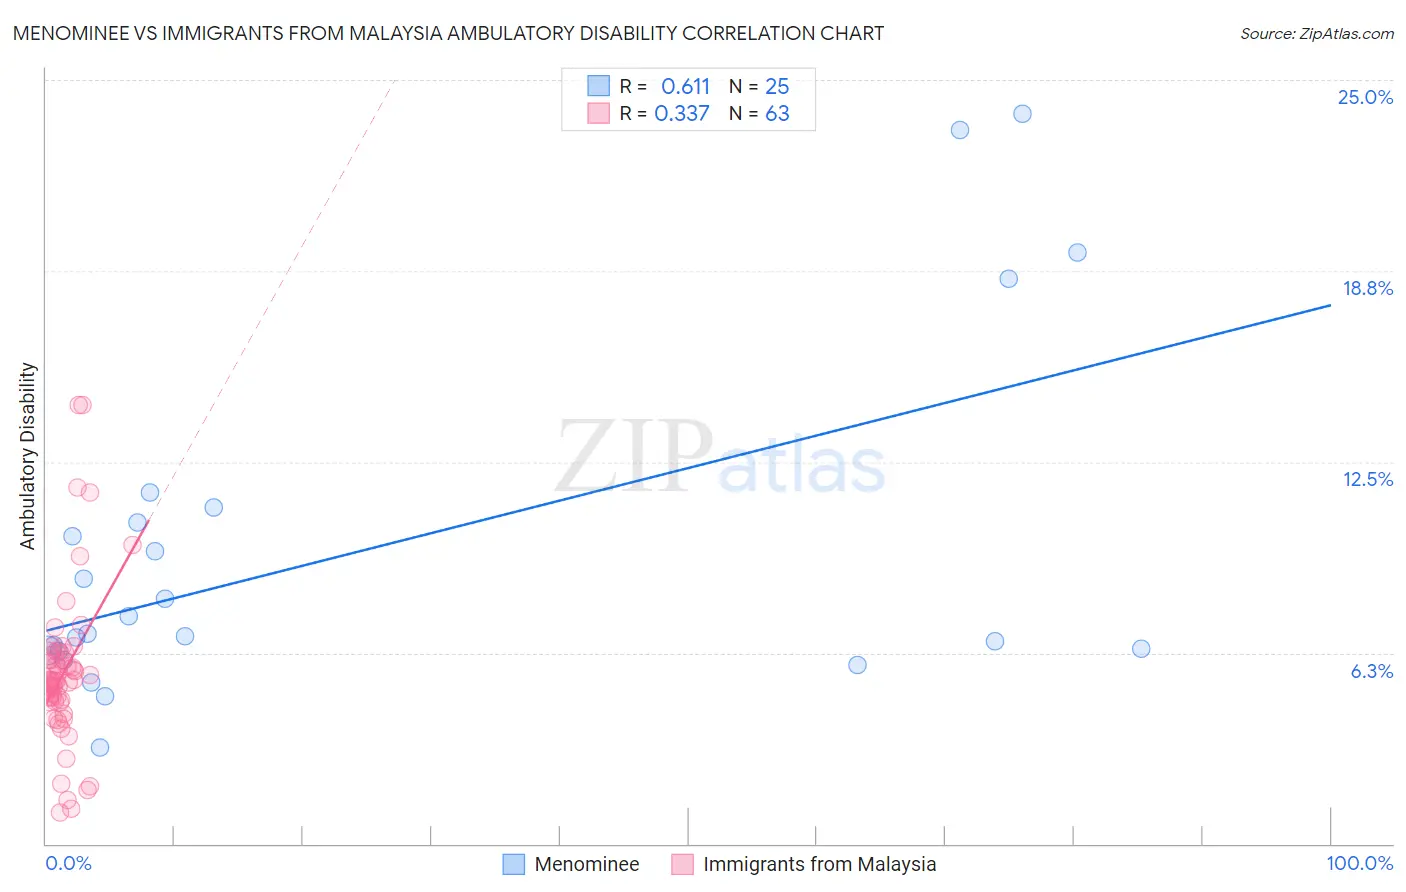
Menominee vs Immigrants from Malaysia Ambulatory Disability Correlation Chart
The statistical analysis conducted on geographies consisting of 45,777,730 people shows a significant positive correlation between the proportion of Menominee and percentage of population with ambulatory disability in the United States with a correlation coefficient (R) of 0.611 and weighted average of 7.8%. Similarly, the statistical analysis conducted on geographies consisting of 197,959,775 people shows a mild positive correlation between the proportion of Immigrants from Malaysia and percentage of population with ambulatory disability in the United States with a correlation coefficient (R) of 0.337 and weighted average of 5.5%, a difference of 42.5%.
Ambulatory Disability Correlation Summary
| Measurement | Menominee | Immigrants from Malaysia |
| Minimum | 3.2% | 1.0% |
| Maximum | 23.9% | 14.4% |
| Range | 20.8% | 13.3% |
| Mean | 9.6% | 5.6% |
| Median | 6.9% | 5.3% |
| Interquartile 25% (IQ1) | 6.3% | 4.7% |
| Interquartile 75% (IQ3) | 10.8% | 6.1% |
| Interquartile Range (IQR) | 4.4% | 1.4% |
| Standard Deviation (Sample) | 5.7% | 2.6% |
| Standard Deviation (Population) | 5.5% | 2.5% |
Similar Demographics by Ambulatory Disability
Demographics Similar to Menominee by Ambulatory Disability
In terms of ambulatory disability, the demographic groups most similar to Menominee are Cajun (7.8%, a difference of 0.28%), Cherokee (7.9%, a difference of 0.89%), Paiute (7.7%, a difference of 1.5%), Yuman (7.9%, a difference of 1.8%), and Pueblo (7.6%, a difference of 2.7%).
| Demographics | Rating | Rank | Ambulatory Disability |
| Comanche | 0.0 /100 | #325 | Tragic 7.5% |
| Blacks/African Americans | 0.0 /100 | #326 | Tragic 7.5% |
| Natives/Alaskans | 0.0 /100 | #327 | Tragic 7.5% |
| Hopi | 0.0 /100 | #328 | Tragic 7.6% |
| Pueblo | 0.0 /100 | #329 | Tragic 7.6% |
| Paiute | 0.0 /100 | #330 | Tragic 7.7% |
| Cajuns | 0.0 /100 | #331 | Tragic 7.8% |
| Menominee | 0.0 /100 | #332 | Tragic 7.8% |
| Cherokee | 0.0 /100 | #333 | Tragic 7.9% |
| Yuman | 0.0 /100 | #334 | Tragic 7.9% |
| Chickasaw | 0.0 /100 | #335 | Tragic 8.0% |
| Seminole | 0.0 /100 | #336 | Tragic 8.0% |
| Dutch West Indians | 0.0 /100 | #337 | Tragic 8.2% |
| Colville | 0.0 /100 | #338 | Tragic 8.2% |
| Pima | 0.0 /100 | #339 | Tragic 8.2% |
Demographics Similar to Immigrants from Malaysia by Ambulatory Disability
In terms of ambulatory disability, the demographic groups most similar to Immigrants from Malaysia are Turkish (5.5%, a difference of 0.020%), Cypriot (5.5%, a difference of 0.020%), Afghan (5.5%, a difference of 0.070%), Immigrants from Asia (5.5%, a difference of 0.11%), and Immigrants from Eritrea (5.5%, a difference of 0.11%).
| Demographics | Rating | Rank | Ambulatory Disability |
| Immigrants | Iran | 100.0 /100 | #29 | Exceptional 5.4% |
| Immigrants | Turkey | 100.0 /100 | #30 | Exceptional 5.4% |
| Immigrants | Venezuela | 100.0 /100 | #31 | Exceptional 5.4% |
| Immigrants | Australia | 100.0 /100 | #32 | Exceptional 5.5% |
| Immigrants | Pakistan | 100.0 /100 | #33 | Exceptional 5.5% |
| Immigrants | Asia | 100.0 /100 | #34 | Exceptional 5.5% |
| Afghans | 100.0 /100 | #35 | Exceptional 5.5% |
| Immigrants | Malaysia | 100.0 /100 | #36 | Exceptional 5.5% |
| Turks | 100.0 /100 | #37 | Exceptional 5.5% |
| Cypriots | 100.0 /100 | #38 | Exceptional 5.5% |
| Immigrants | Eritrea | 100.0 /100 | #39 | Exceptional 5.5% |
| Venezuelans | 99.9 /100 | #40 | Exceptional 5.5% |
| Mongolians | 99.9 /100 | #41 | Exceptional 5.5% |
| Argentineans | 99.9 /100 | #42 | Exceptional 5.5% |
| Paraguayans | 99.9 /100 | #43 | Exceptional 5.5% |