Menominee vs Immigrants from Cabo Verde Ambulatory Disability
COMPARE
Menominee
Immigrants from Cabo Verde
Ambulatory Disability
Ambulatory Disability Comparison
Menominee
Immigrants from Cabo Verde
7.8%
AMBULATORY DISABILITY
0.0/ 100
METRIC RATING
332nd/ 347
METRIC RANK
7.0%
AMBULATORY DISABILITY
0.0/ 100
METRIC RATING
304th/ 347
METRIC RANK
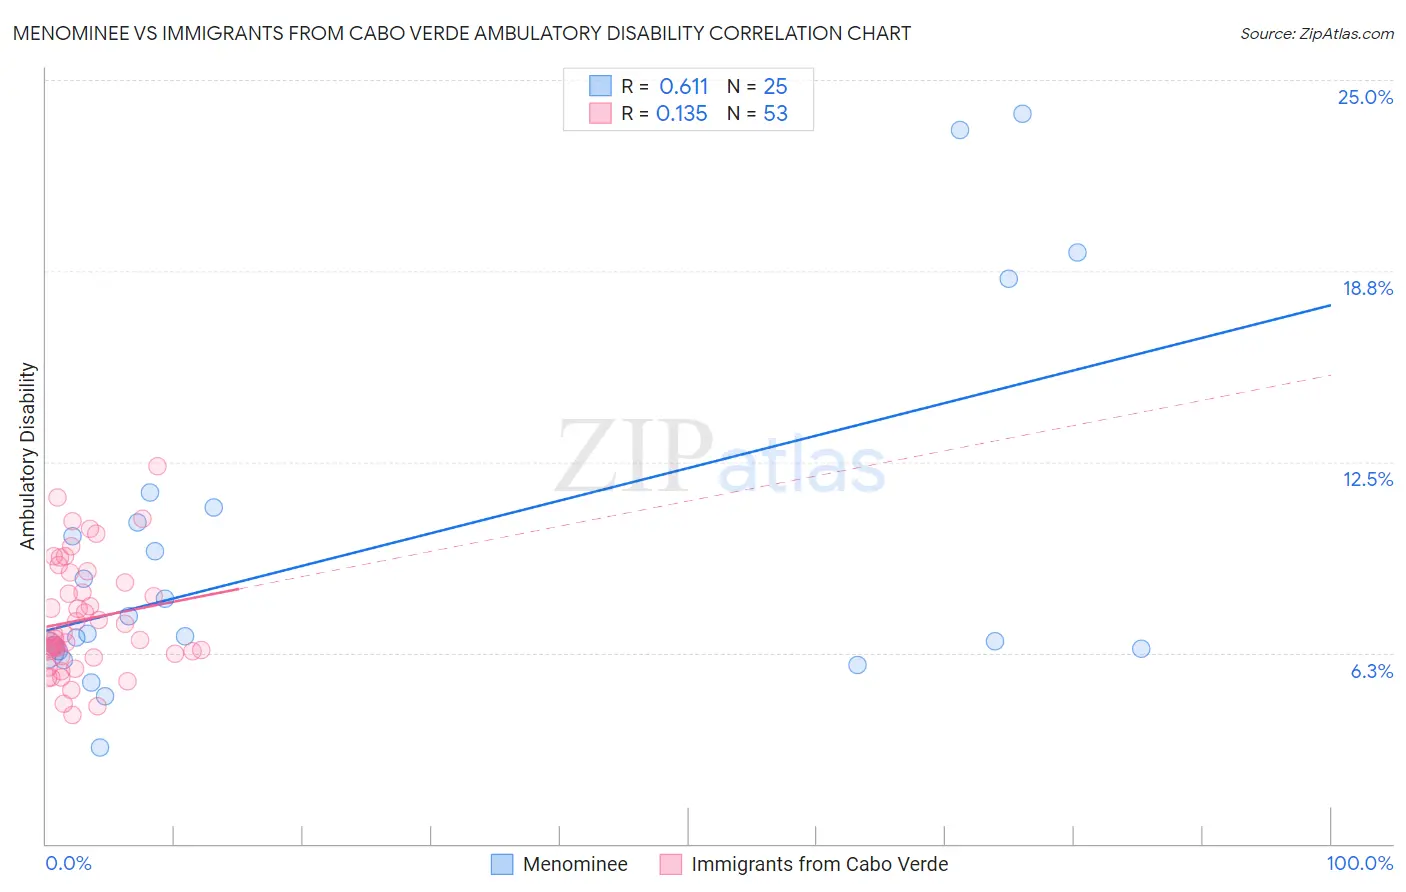
Menominee vs Immigrants from Cabo Verde Ambulatory Disability Correlation Chart
The statistical analysis conducted on geographies consisting of 45,777,730 people shows a significant positive correlation between the proportion of Menominee and percentage of population with ambulatory disability in the United States with a correlation coefficient (R) of 0.611 and weighted average of 7.8%. Similarly, the statistical analysis conducted on geographies consisting of 38,149,836 people shows a poor positive correlation between the proportion of Immigrants from Cabo Verde and percentage of population with ambulatory disability in the United States with a correlation coefficient (R) of 0.135 and weighted average of 7.0%, a difference of 11.6%.
Ambulatory Disability Correlation Summary
| Measurement | Menominee | Immigrants from Cabo Verde |
| Minimum | 3.2% | 4.2% |
| Maximum | 23.9% | 12.3% |
| Range | 20.8% | 8.1% |
| Mean | 9.6% | 7.3% |
| Median | 6.9% | 6.7% |
| Interquartile 25% (IQ1) | 6.3% | 6.2% |
| Interquartile 75% (IQ3) | 10.8% | 8.7% |
| Interquartile Range (IQR) | 4.4% | 2.5% |
| Standard Deviation (Sample) | 5.7% | 1.8% |
| Standard Deviation (Population) | 5.5% | 1.8% |
Similar Demographics by Ambulatory Disability
Demographics Similar to Menominee by Ambulatory Disability
In terms of ambulatory disability, the demographic groups most similar to Menominee are Cajun (7.8%, a difference of 0.28%), Cherokee (7.9%, a difference of 0.89%), Paiute (7.7%, a difference of 1.5%), Yuman (7.9%, a difference of 1.8%), and Pueblo (7.6%, a difference of 2.7%).
| Demographics | Rating | Rank | Ambulatory Disability |
| Comanche | 0.0 /100 | #325 | Tragic 7.5% |
| Blacks/African Americans | 0.0 /100 | #326 | Tragic 7.5% |
| Natives/Alaskans | 0.0 /100 | #327 | Tragic 7.5% |
| Hopi | 0.0 /100 | #328 | Tragic 7.6% |
| Pueblo | 0.0 /100 | #329 | Tragic 7.6% |
| Paiute | 0.0 /100 | #330 | Tragic 7.7% |
| Cajuns | 0.0 /100 | #331 | Tragic 7.8% |
| Menominee | 0.0 /100 | #332 | Tragic 7.8% |
| Cherokee | 0.0 /100 | #333 | Tragic 7.9% |
| Yuman | 0.0 /100 | #334 | Tragic 7.9% |
| Chickasaw | 0.0 /100 | #335 | Tragic 8.0% |
| Seminole | 0.0 /100 | #336 | Tragic 8.0% |
| Dutch West Indians | 0.0 /100 | #337 | Tragic 8.2% |
| Colville | 0.0 /100 | #338 | Tragic 8.2% |
| Pima | 0.0 /100 | #339 | Tragic 8.2% |
Demographics Similar to Immigrants from Cabo Verde by Ambulatory Disability
In terms of ambulatory disability, the demographic groups most similar to Immigrants from Cabo Verde are Immigrants from Micronesia (7.0%, a difference of 0.29%), African (7.0%, a difference of 0.36%), Immigrants from Armenia (7.0%, a difference of 0.42%), British West Indian (7.0%, a difference of 0.47%), and Marshallese (6.9%, a difference of 0.70%).
| Demographics | Rating | Rank | Ambulatory Disability |
| French American Indians | 0.0 /100 | #297 | Tragic 6.9% |
| Immigrants | Grenada | 0.0 /100 | #298 | Tragic 6.9% |
| Puget Sound Salish | 0.0 /100 | #299 | Tragic 6.9% |
| Marshallese | 0.0 /100 | #300 | Tragic 6.9% |
| British West Indians | 0.0 /100 | #301 | Tragic 7.0% |
| Immigrants | Armenia | 0.0 /100 | #302 | Tragic 7.0% |
| Africans | 0.0 /100 | #303 | Tragic 7.0% |
| Immigrants | Cabo Verde | 0.0 /100 | #304 | Tragic 7.0% |
| Immigrants | Micronesia | 0.0 /100 | #305 | Tragic 7.0% |
| Iroquois | 0.0 /100 | #306 | Tragic 7.1% |
| Spanish Americans | 0.0 /100 | #307 | Tragic 7.1% |
| Chippewa | 0.0 /100 | #308 | Tragic 7.1% |
| Immigrants | Azores | 0.0 /100 | #309 | Tragic 7.1% |
| Arapaho | 0.0 /100 | #310 | Tragic 7.1% |
| Cree | 0.0 /100 | #311 | Tragic 7.1% |