Immigrants from Pakistan vs Immigrants from Kuwait Male Disability
COMPARE
Immigrants from Pakistan
Immigrants from Kuwait
Male Disability
Male Disability Comparison
Immigrants from Pakistan
Immigrants from Kuwait
9.8%
MALE DISABILITY
100.0/ 100
METRIC RATING
18th/ 347
METRIC RANK
10.2%
MALE DISABILITY
99.8/ 100
METRIC RATING
38th/ 347
METRIC RANK
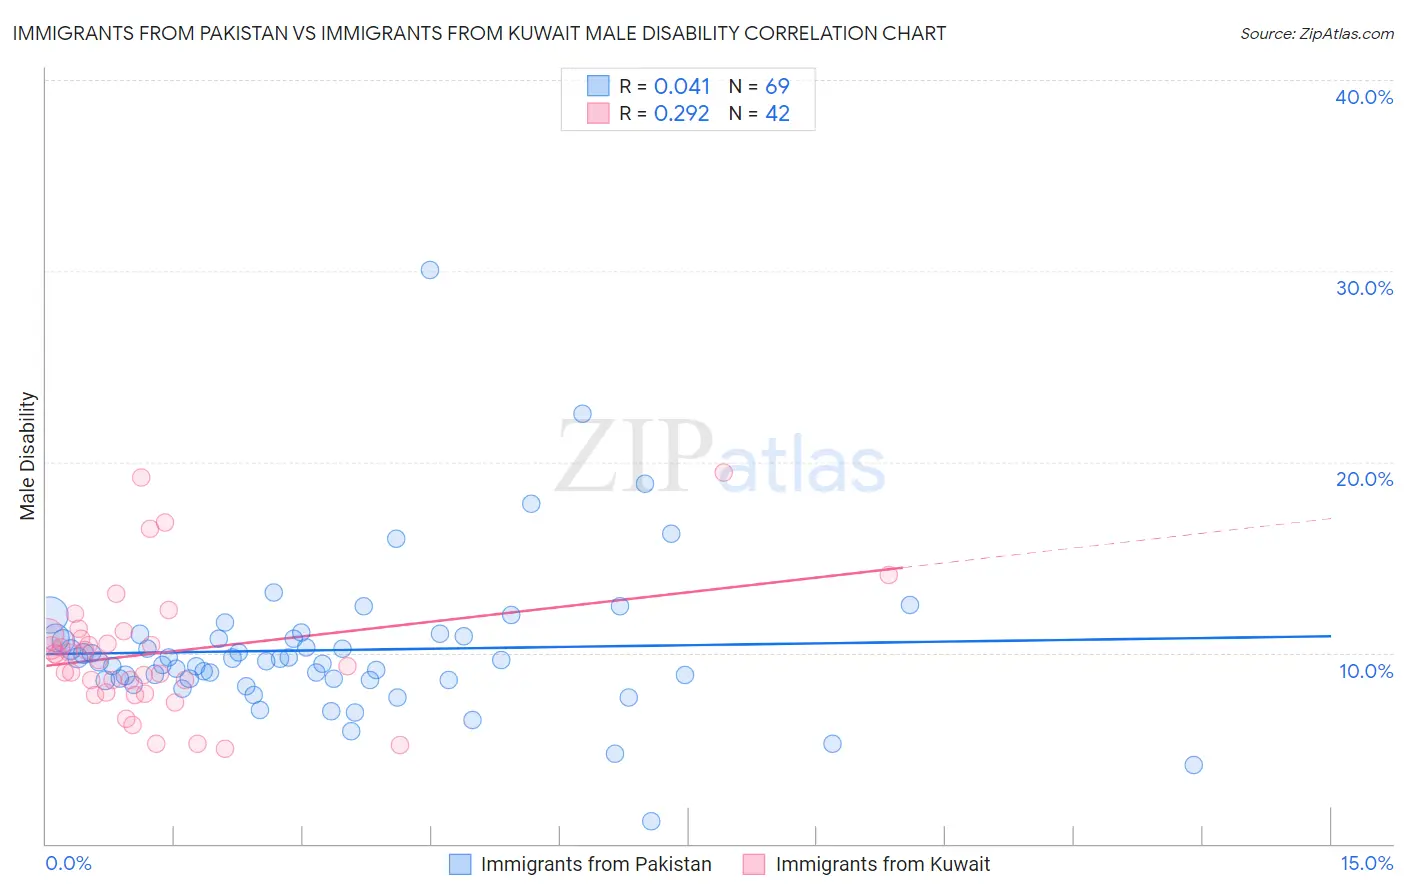
Immigrants from Pakistan vs Immigrants from Kuwait Male Disability Correlation Chart
The statistical analysis conducted on geographies consisting of 283,893,374 people shows no correlation between the proportion of Immigrants from Pakistan and percentage of males with a disability in the United States with a correlation coefficient (R) of 0.041 and weighted average of 9.8%. Similarly, the statistical analysis conducted on geographies consisting of 136,916,630 people shows a weak positive correlation between the proportion of Immigrants from Kuwait and percentage of males with a disability in the United States with a correlation coefficient (R) of 0.292 and weighted average of 10.2%, a difference of 4.0%.
Male Disability Correlation Summary
| Measurement | Immigrants from Pakistan | Immigrants from Kuwait |
| Minimum | 1.2% | 5.0% |
| Maximum | 30.0% | 19.4% |
| Range | 28.8% | 14.4% |
| Mean | 10.1% | 10.0% |
| Median | 9.6% | 9.7% |
| Interquartile 25% (IQ1) | 8.6% | 7.9% |
| Interquartile 75% (IQ3) | 10.8% | 10.9% |
| Interquartile Range (IQR) | 2.2% | 3.0% |
| Standard Deviation (Sample) | 4.0% | 3.4% |
| Standard Deviation (Population) | 4.0% | 3.3% |
Demographics Similar to Immigrants from Pakistan and Immigrants from Kuwait by Male Disability
In terms of male disability, the demographic groups most similar to Immigrants from Pakistan are Immigrants from Sri Lanka (10.0%, a difference of 1.2%), Asian (10.0%, a difference of 1.2%), Burmese (10.0%, a difference of 1.3%), Immigrants from Venezuela (10.0%, a difference of 1.6%), and Cypriot (10.0%, a difference of 1.7%). Similarly, the demographic groups most similar to Immigrants from Kuwait are Immigrants from Indonesia (10.2%, a difference of 0.17%), Ethiopian (10.2%, a difference of 0.24%), Immigrants from Argentina (10.2%, a difference of 0.29%), Immigrants from Turkey (10.2%, a difference of 0.41%), and Immigrants from Ethiopia (10.2%, a difference of 0.47%).
| Demographics | Rating | Rank | Male Disability |
| Immigrants | Pakistan | 100.0 /100 | #18 | Exceptional 9.8% |
| Immigrants | Sri Lanka | 100.0 /100 | #19 | Exceptional 10.0% |
| Asians | 100.0 /100 | #20 | Exceptional 10.0% |
| Burmese | 100.0 /100 | #21 | Exceptional 10.0% |
| Immigrants | Venezuela | 100.0 /100 | #22 | Exceptional 10.0% |
| Cypriots | 100.0 /100 | #23 | Exceptional 10.0% |
| Immigrants | Asia | 100.0 /100 | #24 | Exceptional 10.0% |
| Immigrants | Malaysia | 99.9 /100 | #25 | Exceptional 10.0% |
| Paraguayans | 99.9 /100 | #26 | Exceptional 10.1% |
| Egyptians | 99.9 /100 | #27 | Exceptional 10.1% |
| Vietnamese | 99.9 /100 | #28 | Exceptional 10.1% |
| Venezuelans | 99.9 /100 | #29 | Exceptional 10.1% |
| Immigrants | Egypt | 99.9 /100 | #30 | Exceptional 10.1% |
| Soviet Union | 99.9 /100 | #31 | Exceptional 10.1% |
| Argentineans | 99.9 /100 | #32 | Exceptional 10.1% |
| Immigrants | Ethiopia | 99.9 /100 | #33 | Exceptional 10.2% |
| Immigrants | Turkey | 99.9 /100 | #34 | Exceptional 10.2% |
| Immigrants | Argentina | 99.9 /100 | #35 | Exceptional 10.2% |
| Ethiopians | 99.8 /100 | #36 | Exceptional 10.2% |
| Immigrants | Indonesia | 99.8 /100 | #37 | Exceptional 10.2% |
| Immigrants | Kuwait | 99.8 /100 | #38 | Exceptional 10.2% |