Marshallese vs Immigrants from Kuwait Female Disability
COMPARE
Marshallese
Immigrants from Kuwait
Female Disability
Female Disability Comparison
Marshallese
Immigrants from Kuwait
13.3%
FEMALE DISABILITY
0.0/ 100
METRIC RATING
293rd/ 347
METRIC RANK
11.1%
FEMALE DISABILITY
100.0/ 100
METRIC RATING
31st/ 347
METRIC RANK
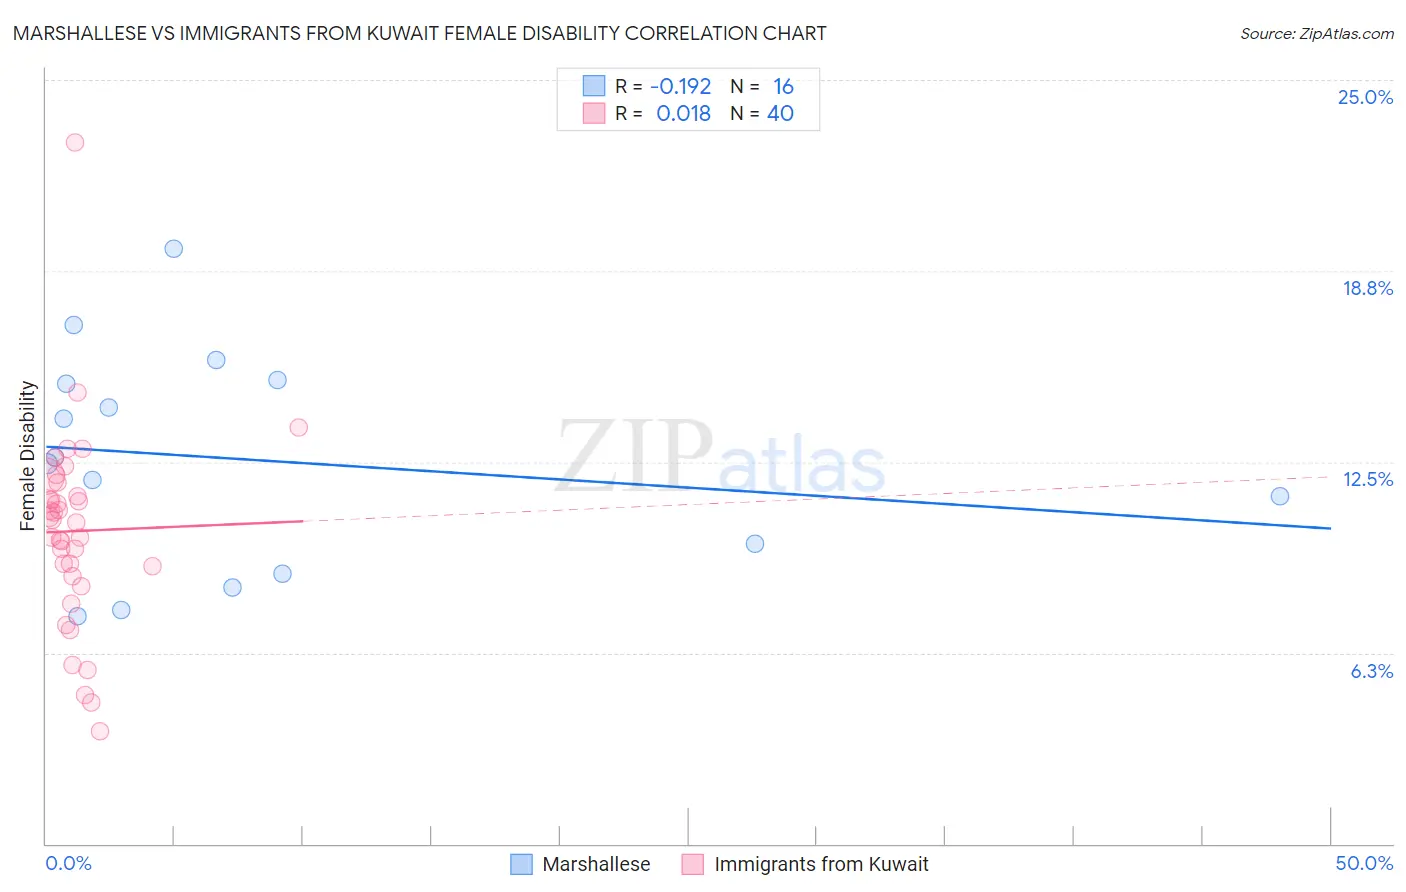
Marshallese vs Immigrants from Kuwait Female Disability Correlation Chart
The statistical analysis conducted on geographies consisting of 14,761,315 people shows a poor negative correlation between the proportion of Marshallese and percentage of females with a disability in the United States with a correlation coefficient (R) of -0.192 and weighted average of 13.3%. Similarly, the statistical analysis conducted on geographies consisting of 136,914,007 people shows no correlation between the proportion of Immigrants from Kuwait and percentage of females with a disability in the United States with a correlation coefficient (R) of 0.018 and weighted average of 11.1%, a difference of 19.4%.
Female Disability Correlation Summary
| Measurement | Marshallese | Immigrants from Kuwait |
| Minimum | 7.4% | 3.7% |
| Maximum | 19.5% | 22.9% |
| Range | 12.1% | 19.3% |
| Mean | 12.6% | 10.2% |
| Median | 12.5% | 10.6% |
| Interquartile 25% (IQ1) | 9.3% | 8.9% |
| Interquartile 75% (IQ3) | 15.1% | 11.6% |
| Interquartile Range (IQR) | 5.8% | 2.7% |
| Standard Deviation (Sample) | 3.5% | 3.3% |
| Standard Deviation (Population) | 3.4% | 3.2% |
Similar Demographics by Female Disability
Demographics Similar to Marshallese by Female Disability
In terms of female disability, the demographic groups most similar to Marshallese are Celtic (13.3%, a difference of 0.050%), Yakama (13.2%, a difference of 0.26%), French (13.3%, a difference of 0.26%), Nepalese (13.3%, a difference of 0.39%), and Slovak (13.3%, a difference of 0.42%).
| Demographics | Rating | Rank | Female Disability |
| Fijians | 0.0 /100 | #286 | Tragic 13.1% |
| Yaqui | 0.0 /100 | #287 | Tragic 13.2% |
| Whites/Caucasians | 0.0 /100 | #288 | Tragic 13.2% |
| Tlingit-Haida | 0.0 /100 | #289 | Tragic 13.2% |
| Immigrants | Yemen | 0.0 /100 | #290 | Tragic 13.2% |
| Shoshone | 0.0 /100 | #291 | Tragic 13.2% |
| Yakama | 0.0 /100 | #292 | Tragic 13.2% |
| Marshallese | 0.0 /100 | #293 | Tragic 13.3% |
| Celtics | 0.0 /100 | #294 | Tragic 13.3% |
| French | 0.0 /100 | #295 | Tragic 13.3% |
| Nepalese | 0.0 /100 | #296 | Tragic 13.3% |
| Slovaks | 0.0 /100 | #297 | Tragic 13.3% |
| Immigrants | Nonimmigrants | 0.0 /100 | #298 | Tragic 13.4% |
| Immigrants | Dominican Republic | 0.0 /100 | #299 | Tragic 13.4% |
| Pennsylvania Germans | 0.0 /100 | #300 | Tragic 13.4% |
Demographics Similar to Immigrants from Kuwait by Female Disability
In terms of female disability, the demographic groups most similar to Immigrants from Kuwait are Immigrants from Malaysia (11.1%, a difference of 0.10%), Turkish (11.1%, a difference of 0.10%), Egyptian (11.1%, a difference of 0.17%), Immigrants from Australia (11.1%, a difference of 0.17%), and Immigrants from Egypt (11.1%, a difference of 0.25%).
| Demographics | Rating | Rank | Female Disability |
| Immigrants | Argentina | 100.0 /100 | #24 | Exceptional 11.0% |
| Immigrants | Asia | 100.0 /100 | #25 | Exceptional 11.0% |
| Argentineans | 100.0 /100 | #26 | Exceptional 11.0% |
| Immigrants | Turkey | 100.0 /100 | #27 | Exceptional 11.1% |
| Egyptians | 100.0 /100 | #28 | Exceptional 11.1% |
| Immigrants | Malaysia | 100.0 /100 | #29 | Exceptional 11.1% |
| Turks | 100.0 /100 | #30 | Exceptional 11.1% |
| Immigrants | Kuwait | 100.0 /100 | #31 | Exceptional 11.1% |
| Immigrants | Australia | 100.0 /100 | #32 | Exceptional 11.1% |
| Immigrants | Egypt | 100.0 /100 | #33 | Exceptional 11.1% |
| Immigrants | Indonesia | 100.0 /100 | #34 | Exceptional 11.2% |
| Immigrants | Japan | 100.0 /100 | #35 | Exceptional 11.2% |
| Cypriots | 100.0 /100 | #36 | Exceptional 11.2% |
| Ethiopians | 100.0 /100 | #37 | Exceptional 11.2% |
| Immigrants | Ethiopia | 100.0 /100 | #38 | Exceptional 11.2% |