Hungarian vs Immigrants from Kuwait Male Disability
COMPARE
Hungarian
Immigrants from Kuwait
Male Disability
Male Disability Comparison
Hungarians
Immigrants from Kuwait
12.0%
MALE DISABILITY
0.8/ 100
METRIC RATING
247th/ 347
METRIC RANK
10.2%
MALE DISABILITY
99.8/ 100
METRIC RATING
38th/ 347
METRIC RANK
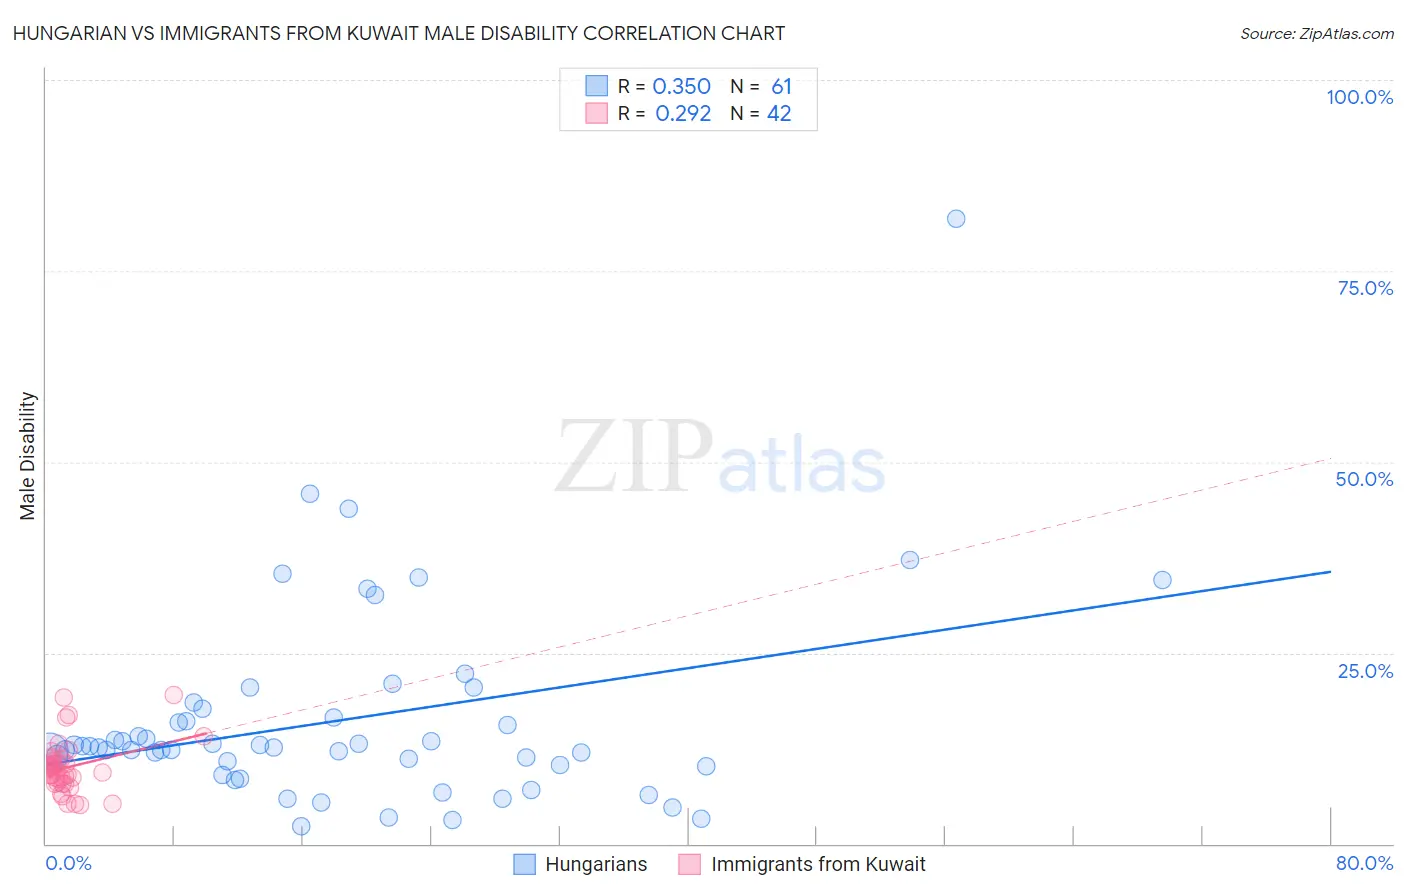
Hungarian vs Immigrants from Kuwait Male Disability Correlation Chart
The statistical analysis conducted on geographies consisting of 486,137,114 people shows a mild positive correlation between the proportion of Hungarians and percentage of males with a disability in the United States with a correlation coefficient (R) of 0.350 and weighted average of 12.0%. Similarly, the statistical analysis conducted on geographies consisting of 136,916,630 people shows a weak positive correlation between the proportion of Immigrants from Kuwait and percentage of males with a disability in the United States with a correlation coefficient (R) of 0.292 and weighted average of 10.2%, a difference of 16.9%.
Male Disability Correlation Summary
| Measurement | Hungarian | Immigrants from Kuwait |
| Minimum | 2.3% | 5.0% |
| Maximum | 81.8% | 19.4% |
| Range | 79.5% | 14.4% |
| Mean | 16.2% | 10.0% |
| Median | 12.6% | 9.7% |
| Interquartile 25% (IQ1) | 10.2% | 7.9% |
| Interquartile 75% (IQ3) | 17.1% | 10.9% |
| Interquartile Range (IQR) | 6.9% | 3.0% |
| Standard Deviation (Sample) | 13.0% | 3.4% |
| Standard Deviation (Population) | 12.9% | 3.3% |
Similar Demographics by Male Disability
Demographics Similar to Hungarians by Male Disability
In terms of male disability, the demographic groups most similar to Hungarians are Polish (12.0%, a difference of 0.18%), Danish (11.9%, a difference of 0.19%), Immigrants from Laos (11.9%, a difference of 0.22%), Immigrants from Liberia (11.9%, a difference of 0.22%), and Samoan (11.9%, a difference of 0.34%).
| Demographics | Rating | Rank | Male Disability |
| Czechs | 1.1 /100 | #240 | Tragic 11.9% |
| Bahamians | 1.1 /100 | #241 | Tragic 11.9% |
| Northern Europeans | 1.1 /100 | #242 | Tragic 11.9% |
| Samoans | 1.1 /100 | #243 | Tragic 11.9% |
| Immigrants | Laos | 1.0 /100 | #244 | Tragic 11.9% |
| Immigrants | Liberia | 1.0 /100 | #245 | Tragic 11.9% |
| Danes | 0.9 /100 | #246 | Tragic 11.9% |
| Hungarians | 0.8 /100 | #247 | Tragic 12.0% |
| Poles | 0.7 /100 | #248 | Tragic 12.0% |
| Immigrants | Yemen | 0.5 /100 | #249 | Tragic 12.0% |
| Bangladeshis | 0.5 /100 | #250 | Tragic 12.0% |
| German Russians | 0.5 /100 | #251 | Tragic 12.0% |
| Slovenes | 0.5 /100 | #252 | Tragic 12.0% |
| Guamanians/Chamorros | 0.5 /100 | #253 | Tragic 12.0% |
| British | 0.4 /100 | #254 | Tragic 12.1% |
Demographics Similar to Immigrants from Kuwait by Male Disability
In terms of male disability, the demographic groups most similar to Immigrants from Kuwait are Afghan (10.2%, a difference of 0.16%), Immigrants from Indonesia (10.2%, a difference of 0.17%), Ethiopian (10.2%, a difference of 0.24%), Immigrants from Argentina (10.2%, a difference of 0.29%), and Immigrants from Nepal (10.3%, a difference of 0.35%).
| Demographics | Rating | Rank | Male Disability |
| Soviet Union | 99.9 /100 | #31 | Exceptional 10.1% |
| Argentineans | 99.9 /100 | #32 | Exceptional 10.1% |
| Immigrants | Ethiopia | 99.9 /100 | #33 | Exceptional 10.2% |
| Immigrants | Turkey | 99.9 /100 | #34 | Exceptional 10.2% |
| Immigrants | Argentina | 99.9 /100 | #35 | Exceptional 10.2% |
| Ethiopians | 99.8 /100 | #36 | Exceptional 10.2% |
| Immigrants | Indonesia | 99.8 /100 | #37 | Exceptional 10.2% |
| Immigrants | Kuwait | 99.8 /100 | #38 | Exceptional 10.2% |
| Afghans | 99.8 /100 | #39 | Exceptional 10.2% |
| Immigrants | Nepal | 99.8 /100 | #40 | Exceptional 10.3% |
| Taiwanese | 99.8 /100 | #41 | Exceptional 10.3% |
| Mongolians | 99.7 /100 | #42 | Exceptional 10.3% |
| Immigrants | Bangladesh | 99.7 /100 | #43 | Exceptional 10.3% |
| Immigrants | El Salvador | 99.7 /100 | #44 | Exceptional 10.3% |
| Turks | 99.7 /100 | #45 | Exceptional 10.3% |