Chilean vs Paiute Disability
COMPARE
Chilean
Paiute
Disability
Disability Comparison
Chileans
Paiute
11.1%
DISABILITY
99.1/ 100
METRIC RATING
82nd/ 347
METRIC RANK
13.9%
DISABILITY
0.0/ 100
METRIC RATING
321st/ 347
METRIC RANK
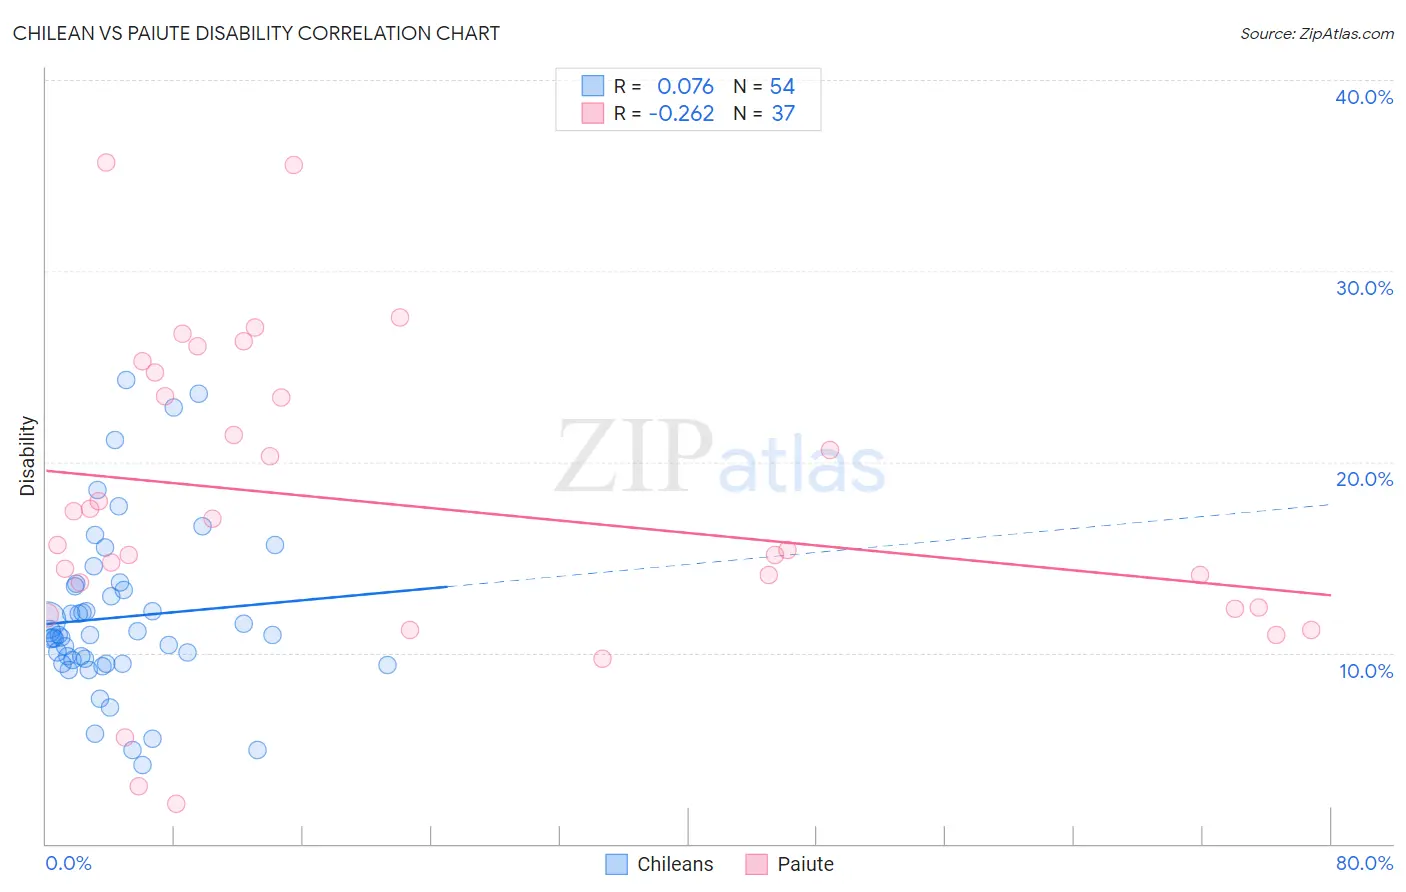
Chilean vs Paiute Disability Correlation Chart
The statistical analysis conducted on geographies consisting of 256,664,875 people shows a slight positive correlation between the proportion of Chileans and percentage of population with a disability in the United States with a correlation coefficient (R) of 0.076 and weighted average of 11.1%. Similarly, the statistical analysis conducted on geographies consisting of 58,394,773 people shows a weak negative correlation between the proportion of Paiute and percentage of population with a disability in the United States with a correlation coefficient (R) of -0.262 and weighted average of 13.9%, a difference of 25.0%.
Disability Correlation Summary
| Measurement | Chilean | Paiute |
| Minimum | 4.1% | 2.1% |
| Maximum | 24.3% | 35.7% |
| Range | 20.2% | 33.6% |
| Mean | 11.9% | 17.7% |
| Median | 10.9% | 15.7% |
| Interquartile 25% (IQ1) | 9.5% | 12.3% |
| Interquartile 75% (IQ3) | 13.5% | 24.0% |
| Interquartile Range (IQR) | 4.0% | 11.7% |
| Standard Deviation (Sample) | 4.4% | 7.9% |
| Standard Deviation (Population) | 4.4% | 7.8% |
Similar Demographics by Disability
Demographics Similar to Chileans by Disability
In terms of disability, the demographic groups most similar to Chileans are Immigrants from Switzerland (11.1%, a difference of 0.030%), Immigrants from Poland (11.1%, a difference of 0.050%), Immigrants from Sierra Leone (11.1%, a difference of 0.050%), Immigrants from Belarus (11.1%, a difference of 0.19%), and Immigrants from Russia (11.1%, a difference of 0.20%).
| Demographics | Rating | Rank | Disability |
| Immigrants | Vietnam | 99.4 /100 | #75 | Exceptional 11.0% |
| Sierra Leoneans | 99.3 /100 | #76 | Exceptional 11.0% |
| Immigrants | Belgium | 99.3 /100 | #77 | Exceptional 11.0% |
| Immigrants | Cameroon | 99.3 /100 | #78 | Exceptional 11.1% |
| Immigrants | Jordan | 99.3 /100 | #79 | Exceptional 11.1% |
| Immigrants | Ireland | 99.3 /100 | #80 | Exceptional 11.1% |
| Immigrants | Poland | 99.1 /100 | #81 | Exceptional 11.1% |
| Chileans | 99.1 /100 | #82 | Exceptional 11.1% |
| Immigrants | Switzerland | 99.0 /100 | #83 | Exceptional 11.1% |
| Immigrants | Sierra Leone | 99.0 /100 | #84 | Exceptional 11.1% |
| Immigrants | Belarus | 98.9 /100 | #85 | Exceptional 11.1% |
| Immigrants | Russia | 98.9 /100 | #86 | Exceptional 11.1% |
| Palestinians | 98.9 /100 | #87 | Exceptional 11.1% |
| Immigrants | Romania | 98.5 /100 | #88 | Exceptional 11.2% |
| Immigrants | South Africa | 98.2 /100 | #89 | Exceptional 11.2% |
Demographics Similar to Paiute by Disability
In terms of disability, the demographic groups most similar to Paiute are Apache (13.9%, a difference of 0.13%), Iroquois (13.8%, a difference of 0.42%), American (13.9%, a difference of 0.42%), Menominee (13.8%, a difference of 0.63%), and Pima (13.7%, a difference of 1.2%).
| Demographics | Rating | Rank | Disability |
| Blacks/African Americans | 0.0 /100 | #314 | Tragic 13.7% |
| Puget Sound Salish | 0.0 /100 | #315 | Tragic 13.7% |
| Pima | 0.0 /100 | #316 | Tragic 13.7% |
| Immigrants | Cabo Verde | 0.0 /100 | #317 | Tragic 13.7% |
| Menominee | 0.0 /100 | #318 | Tragic 13.8% |
| Iroquois | 0.0 /100 | #319 | Tragic 13.8% |
| Apache | 0.0 /100 | #320 | Tragic 13.9% |
| Paiute | 0.0 /100 | #321 | Tragic 13.9% |
| Americans | 0.0 /100 | #322 | Tragic 13.9% |
| Comanche | 0.0 /100 | #323 | Tragic 14.1% |
| Chippewa | 0.0 /100 | #324 | Tragic 14.1% |
| Natives/Alaskans | 0.0 /100 | #325 | Tragic 14.2% |
| Osage | 0.0 /100 | #326 | Tragic 14.2% |
| Ottawa | 0.0 /100 | #327 | Tragic 14.2% |
| Immigrants | Azores | 0.0 /100 | #328 | Tragic 14.2% |