Immigrants from Turkey vs Paiute Disability
COMPARE
Immigrants from Turkey
Paiute
Disability
Disability Comparison
Immigrants from Turkey
Paiute
10.6%
DISABILITY
100.0/ 100
METRIC RATING
30th/ 347
METRIC RANK
13.9%
DISABILITY
0.0/ 100
METRIC RATING
321st/ 347
METRIC RANK
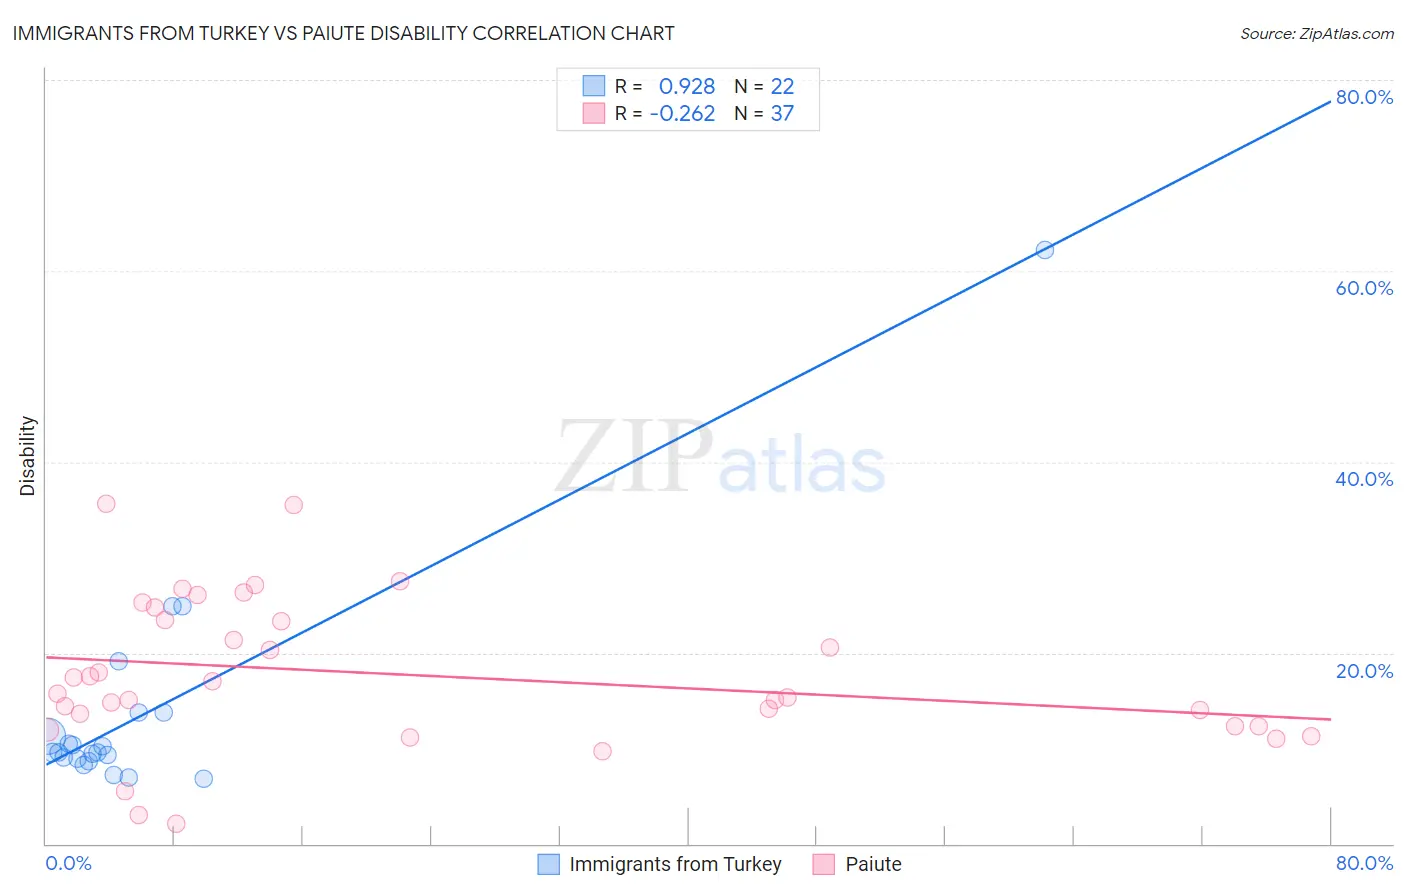
Immigrants from Turkey vs Paiute Disability Correlation Chart
The statistical analysis conducted on geographies consisting of 223,052,845 people shows a near-perfect positive correlation between the proportion of Immigrants from Turkey and percentage of population with a disability in the United States with a correlation coefficient (R) of 0.928 and weighted average of 10.6%. Similarly, the statistical analysis conducted on geographies consisting of 58,394,773 people shows a weak negative correlation between the proportion of Paiute and percentage of population with a disability in the United States with a correlation coefficient (R) of -0.262 and weighted average of 13.9%, a difference of 30.5%.
Disability Correlation Summary
| Measurement | Immigrants from Turkey | Paiute |
| Minimum | 6.9% | 2.1% |
| Maximum | 62.2% | 35.7% |
| Range | 55.3% | 33.6% |
| Mean | 13.8% | 17.7% |
| Median | 9.6% | 15.7% |
| Interquartile 25% (IQ1) | 8.9% | 12.3% |
| Interquartile 75% (IQ3) | 13.8% | 24.0% |
| Interquartile Range (IQR) | 4.8% | 11.7% |
| Standard Deviation (Sample) | 11.9% | 7.9% |
| Standard Deviation (Population) | 11.7% | 7.8% |
Similar Demographics by Disability
Demographics Similar to Immigrants from Turkey by Disability
In terms of disability, the demographic groups most similar to Immigrants from Turkey are Immigrants from Egypt (10.6%, a difference of 0.070%), Immigrants from Argentina (10.6%, a difference of 0.15%), Paraguayan (10.6%, a difference of 0.17%), Egyptian (10.6%, a difference of 0.28%), and Cypriot (10.6%, a difference of 0.41%).
| Demographics | Rating | Rank | Disability |
| Immigrants | Asia | 100.0 /100 | #23 | Exceptional 10.5% |
| Venezuelans | 100.0 /100 | #24 | Exceptional 10.5% |
| Immigrants | Malaysia | 100.0 /100 | #25 | Exceptional 10.6% |
| Argentineans | 100.0 /100 | #26 | Exceptional 10.6% |
| Cypriots | 100.0 /100 | #27 | Exceptional 10.6% |
| Egyptians | 100.0 /100 | #28 | Exceptional 10.6% |
| Immigrants | Argentina | 100.0 /100 | #29 | Exceptional 10.6% |
| Immigrants | Turkey | 100.0 /100 | #30 | Exceptional 10.6% |
| Immigrants | Egypt | 100.0 /100 | #31 | Exceptional 10.6% |
| Paraguayans | 100.0 /100 | #32 | Exceptional 10.6% |
| Immigrants | Kuwait | 100.0 /100 | #33 | Exceptional 10.7% |
| Immigrants | Ethiopia | 100.0 /100 | #34 | Exceptional 10.7% |
| Immigrants | Indonesia | 100.0 /100 | #35 | Exceptional 10.7% |
| Ethiopians | 100.0 /100 | #36 | Exceptional 10.7% |
| Turks | 100.0 /100 | #37 | Exceptional 10.7% |
Demographics Similar to Paiute by Disability
In terms of disability, the demographic groups most similar to Paiute are Apache (13.9%, a difference of 0.13%), Iroquois (13.8%, a difference of 0.42%), American (13.9%, a difference of 0.42%), Menominee (13.8%, a difference of 0.63%), and Pima (13.7%, a difference of 1.2%).
| Demographics | Rating | Rank | Disability |
| Blacks/African Americans | 0.0 /100 | #314 | Tragic 13.7% |
| Puget Sound Salish | 0.0 /100 | #315 | Tragic 13.7% |
| Pima | 0.0 /100 | #316 | Tragic 13.7% |
| Immigrants | Cabo Verde | 0.0 /100 | #317 | Tragic 13.7% |
| Menominee | 0.0 /100 | #318 | Tragic 13.8% |
| Iroquois | 0.0 /100 | #319 | Tragic 13.8% |
| Apache | 0.0 /100 | #320 | Tragic 13.9% |
| Paiute | 0.0 /100 | #321 | Tragic 13.9% |
| Americans | 0.0 /100 | #322 | Tragic 13.9% |
| Comanche | 0.0 /100 | #323 | Tragic 14.1% |
| Chippewa | 0.0 /100 | #324 | Tragic 14.1% |
| Natives/Alaskans | 0.0 /100 | #325 | Tragic 14.2% |
| Osage | 0.0 /100 | #326 | Tragic 14.2% |
| Ottawa | 0.0 /100 | #327 | Tragic 14.2% |
| Immigrants | Azores | 0.0 /100 | #328 | Tragic 14.2% |