Estonian vs Paiute Disability
COMPARE
Estonian
Paiute
Disability
Disability Comparison
Estonians
Paiute
11.7%
DISABILITY
54.4/ 100
METRIC RATING
167th/ 347
METRIC RANK
13.9%
DISABILITY
0.0/ 100
METRIC RATING
321st/ 347
METRIC RANK
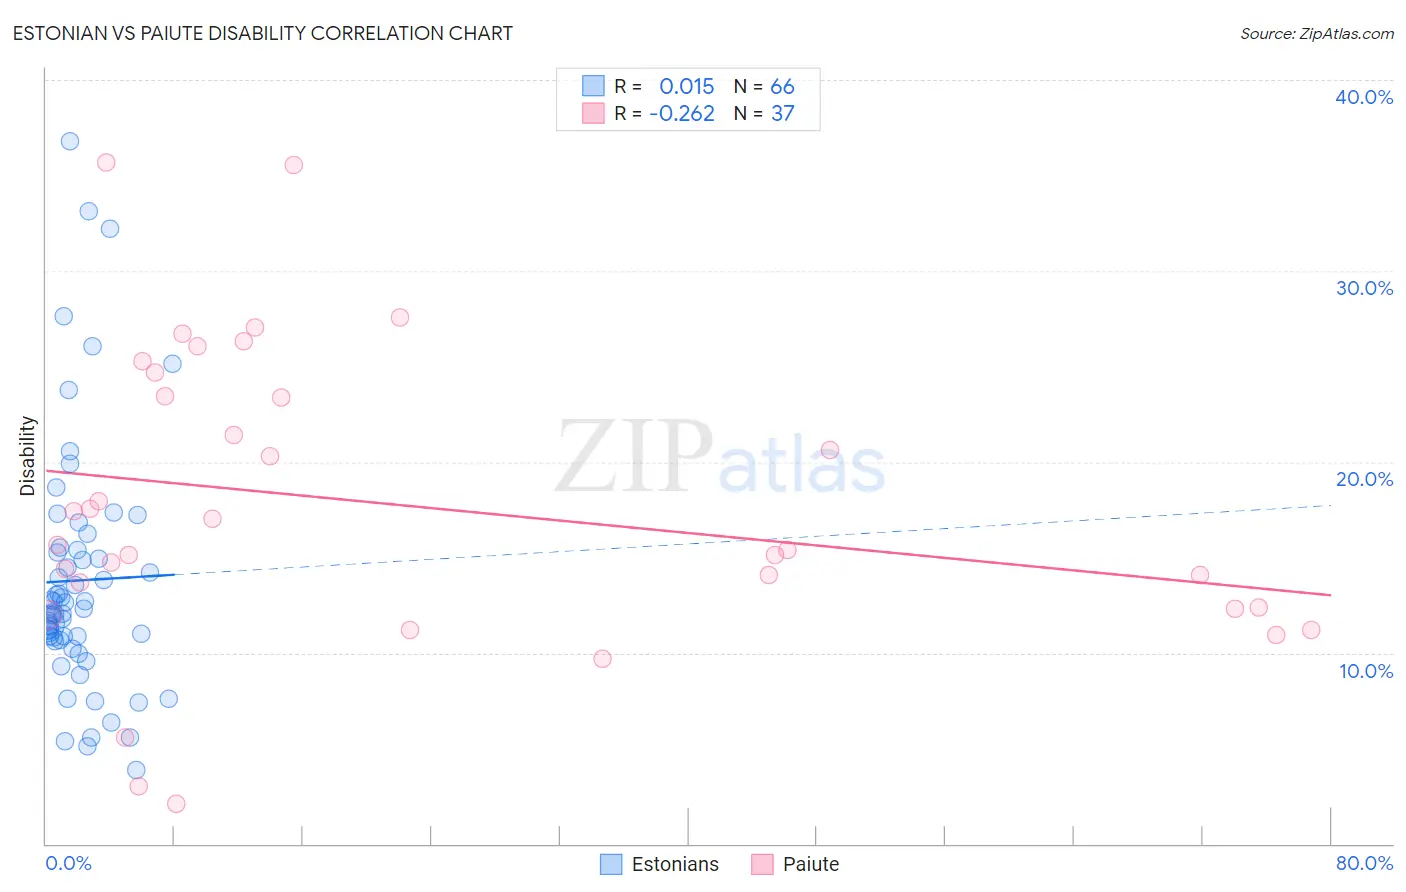
Estonian vs Paiute Disability Correlation Chart
The statistical analysis conducted on geographies consisting of 123,527,631 people shows no correlation between the proportion of Estonians and percentage of population with a disability in the United States with a correlation coefficient (R) of 0.015 and weighted average of 11.7%. Similarly, the statistical analysis conducted on geographies consisting of 58,394,773 people shows a weak negative correlation between the proportion of Paiute and percentage of population with a disability in the United States with a correlation coefficient (R) of -0.262 and weighted average of 13.9%, a difference of 18.8%.
Disability Correlation Summary
| Measurement | Estonian | Paiute |
| Minimum | 3.8% | 2.1% |
| Maximum | 36.8% | 35.7% |
| Range | 33.0% | 33.6% |
| Mean | 13.8% | 17.7% |
| Median | 12.2% | 15.7% |
| Interquartile 25% (IQ1) | 10.7% | 12.3% |
| Interquartile 75% (IQ3) | 15.4% | 24.0% |
| Interquartile Range (IQR) | 4.8% | 11.7% |
| Standard Deviation (Sample) | 6.6% | 7.9% |
| Standard Deviation (Population) | 6.5% | 7.8% |
Similar Demographics by Disability
Demographics Similar to Estonians by Disability
In terms of disability, the demographic groups most similar to Estonians are Pakistani (11.7%, a difference of 0.010%), Immigrants from Latin America (11.7%, a difference of 0.020%), Immigrants from Austria (11.7%, a difference of 0.050%), Immigrants from Albania (11.7%, a difference of 0.070%), and Immigrants from Southern Europe (11.7%, a difference of 0.070%).
| Demographics | Rating | Rank | Disability |
| Immigrants | Barbados | 64.2 /100 | #160 | Good 11.6% |
| Immigrants | Cuba | 62.8 /100 | #161 | Good 11.6% |
| Immigrants | Haiti | 59.2 /100 | #162 | Average 11.7% |
| Immigrants | Trinidad and Tobago | 58.9 /100 | #163 | Average 11.7% |
| Syrians | 58.5 /100 | #164 | Average 11.7% |
| Cubans | 56.7 /100 | #165 | Average 11.7% |
| Pakistanis | 54.7 /100 | #166 | Average 11.7% |
| Estonians | 54.4 /100 | #167 | Average 11.7% |
| Immigrants | Latin America | 54.1 /100 | #168 | Average 11.7% |
| Immigrants | Austria | 53.4 /100 | #169 | Average 11.7% |
| Immigrants | Albania | 52.8 /100 | #170 | Average 11.7% |
| Immigrants | Southern Europe | 52.8 /100 | #171 | Average 11.7% |
| Trinidadians and Tobagonians | 52.7 /100 | #172 | Average 11.7% |
| Maltese | 50.6 /100 | #173 | Average 11.7% |
| Albanians | 50.0 /100 | #174 | Average 11.7% |
Demographics Similar to Paiute by Disability
In terms of disability, the demographic groups most similar to Paiute are Apache (13.9%, a difference of 0.13%), Iroquois (13.8%, a difference of 0.42%), American (13.9%, a difference of 0.42%), Menominee (13.8%, a difference of 0.63%), and Pima (13.7%, a difference of 1.2%).
| Demographics | Rating | Rank | Disability |
| Blacks/African Americans | 0.0 /100 | #314 | Tragic 13.7% |
| Puget Sound Salish | 0.0 /100 | #315 | Tragic 13.7% |
| Pima | 0.0 /100 | #316 | Tragic 13.7% |
| Immigrants | Cabo Verde | 0.0 /100 | #317 | Tragic 13.7% |
| Menominee | 0.0 /100 | #318 | Tragic 13.8% |
| Iroquois | 0.0 /100 | #319 | Tragic 13.8% |
| Apache | 0.0 /100 | #320 | Tragic 13.9% |
| Paiute | 0.0 /100 | #321 | Tragic 13.9% |
| Americans | 0.0 /100 | #322 | Tragic 13.9% |
| Comanche | 0.0 /100 | #323 | Tragic 14.1% |
| Chippewa | 0.0 /100 | #324 | Tragic 14.1% |
| Natives/Alaskans | 0.0 /100 | #325 | Tragic 14.2% |
| Osage | 0.0 /100 | #326 | Tragic 14.2% |
| Ottawa | 0.0 /100 | #327 | Tragic 14.2% |
| Immigrants | Azores | 0.0 /100 | #328 | Tragic 14.2% |