Vietnamese vs Paiute Disability
COMPARE
Vietnamese
Paiute
Disability
Disability Comparison
Vietnamese
Paiute
10.9%
DISABILITY
99.9/ 100
METRIC RATING
49th/ 347
METRIC RANK
13.9%
DISABILITY
0.0/ 100
METRIC RATING
321st/ 347
METRIC RANK
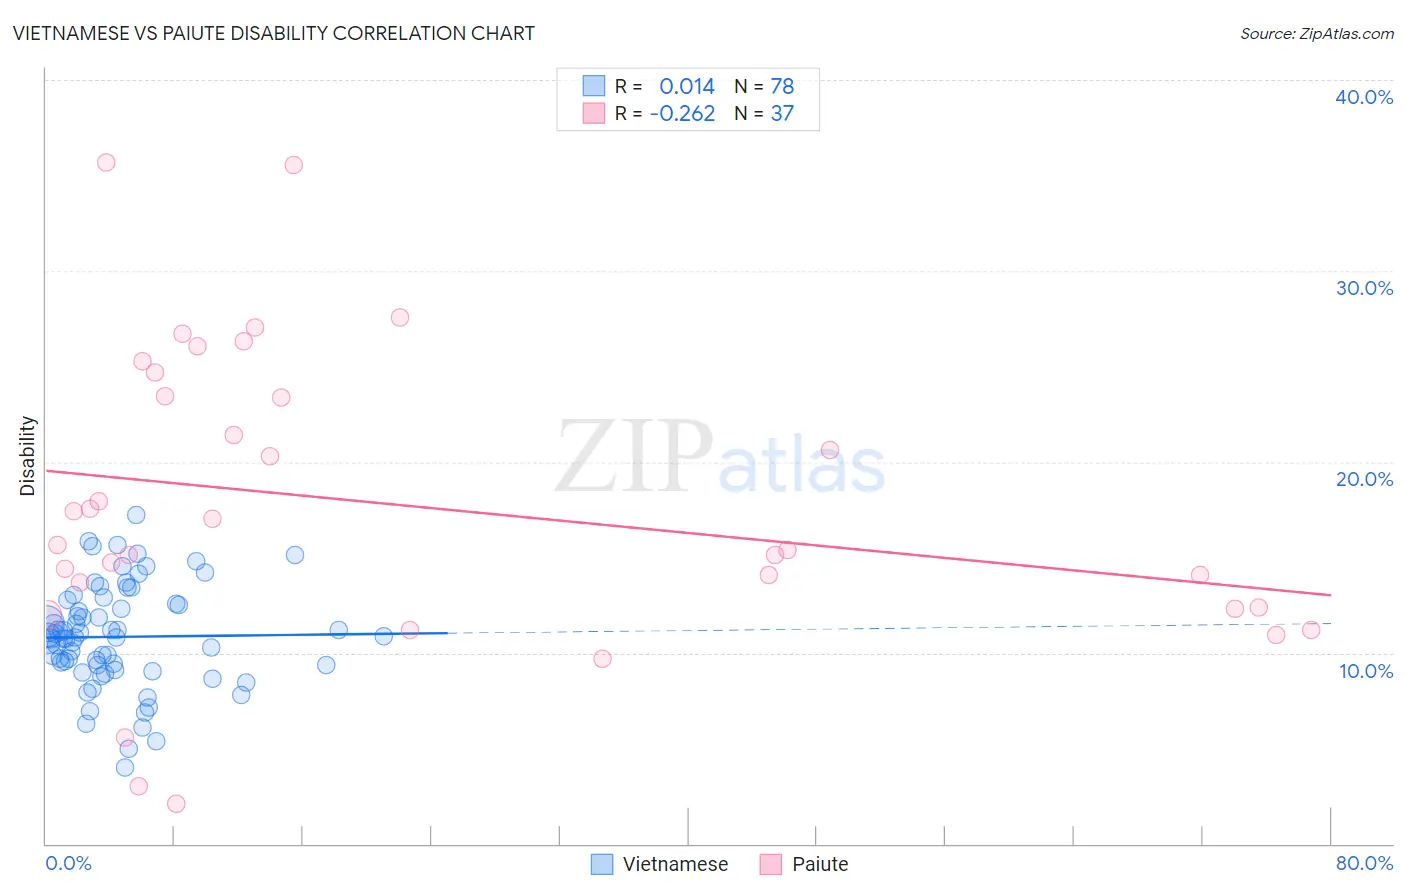
Vietnamese vs Paiute Disability Correlation Chart
The statistical analysis conducted on geographies consisting of 170,758,607 people shows no correlation between the proportion of Vietnamese and percentage of population with a disability in the United States with a correlation coefficient (R) of 0.014 and weighted average of 10.9%. Similarly, the statistical analysis conducted on geographies consisting of 58,394,773 people shows a weak negative correlation between the proportion of Paiute and percentage of population with a disability in the United States with a correlation coefficient (R) of -0.262 and weighted average of 13.9%, a difference of 27.8%.
Disability Correlation Summary
| Measurement | Vietnamese | Paiute |
| Minimum | 4.0% | 2.1% |
| Maximum | 17.2% | 35.7% |
| Range | 13.2% | 33.6% |
| Mean | 10.8% | 17.7% |
| Median | 10.8% | 15.7% |
| Interquartile 25% (IQ1) | 9.4% | 12.3% |
| Interquartile 75% (IQ3) | 12.6% | 24.0% |
| Interquartile Range (IQR) | 3.2% | 11.7% |
| Standard Deviation (Sample) | 2.7% | 7.9% |
| Standard Deviation (Population) | 2.7% | 7.8% |
Similar Demographics by Disability
Demographics Similar to Vietnamese by Disability
In terms of disability, the demographic groups most similar to Vietnamese are Immigrants from Saudi Arabia (10.9%, a difference of 0.0%), Peruvian (10.9%, a difference of 0.010%), Soviet Union (10.9%, a difference of 0.060%), South American (10.9%, a difference of 0.070%), and Immigrants from Spain (10.9%, a difference of 0.090%).
| Demographics | Rating | Rank | Disability |
| Immigrants | Nepal | 99.9 /100 | #42 | Exceptional 10.8% |
| Israelis | 99.9 /100 | #43 | Exceptional 10.8% |
| Immigrants | Japan | 99.9 /100 | #44 | Exceptional 10.8% |
| Immigrants | Peru | 99.9 /100 | #45 | Exceptional 10.8% |
| Tongans | 99.9 /100 | #46 | Exceptional 10.8% |
| Taiwanese | 99.9 /100 | #47 | Exceptional 10.8% |
| Soviet Union | 99.9 /100 | #48 | Exceptional 10.9% |
| Vietnamese | 99.9 /100 | #49 | Exceptional 10.9% |
| Immigrants | Saudi Arabia | 99.9 /100 | #50 | Exceptional 10.9% |
| Peruvians | 99.8 /100 | #51 | Exceptional 10.9% |
| South Americans | 99.8 /100 | #52 | Exceptional 10.9% |
| Immigrants | Spain | 99.8 /100 | #53 | Exceptional 10.9% |
| Jordanians | 99.8 /100 | #54 | Exceptional 10.9% |
| Immigrants | El Salvador | 99.8 /100 | #55 | Exceptional 10.9% |
| Immigrants | Lithuania | 99.8 /100 | #56 | Exceptional 10.9% |
Demographics Similar to Paiute by Disability
In terms of disability, the demographic groups most similar to Paiute are Apache (13.9%, a difference of 0.13%), Iroquois (13.8%, a difference of 0.42%), American (13.9%, a difference of 0.42%), Menominee (13.8%, a difference of 0.63%), and Pima (13.7%, a difference of 1.2%).
| Demographics | Rating | Rank | Disability |
| Blacks/African Americans | 0.0 /100 | #314 | Tragic 13.7% |
| Puget Sound Salish | 0.0 /100 | #315 | Tragic 13.7% |
| Pima | 0.0 /100 | #316 | Tragic 13.7% |
| Immigrants | Cabo Verde | 0.0 /100 | #317 | Tragic 13.7% |
| Menominee | 0.0 /100 | #318 | Tragic 13.8% |
| Iroquois | 0.0 /100 | #319 | Tragic 13.8% |
| Apache | 0.0 /100 | #320 | Tragic 13.9% |
| Paiute | 0.0 /100 | #321 | Tragic 13.9% |
| Americans | 0.0 /100 | #322 | Tragic 13.9% |
| Comanche | 0.0 /100 | #323 | Tragic 14.1% |
| Chippewa | 0.0 /100 | #324 | Tragic 14.1% |
| Natives/Alaskans | 0.0 /100 | #325 | Tragic 14.2% |
| Osage | 0.0 /100 | #326 | Tragic 14.2% |
| Ottawa | 0.0 /100 | #327 | Tragic 14.2% |
| Immigrants | Azores | 0.0 /100 | #328 | Tragic 14.2% |