Black/African American vs Native Hawaiian Disability
COMPARE
Black/African American
Native Hawaiian
Disability
Disability Comparison
Blacks/African Americans
Native Hawaiians
13.7%
DISABILITY
0.0/ 100
METRIC RATING
314th/ 347
METRIC RANK
12.5%
DISABILITY
0.3/ 100
METRIC RATING
262nd/ 347
METRIC RANK
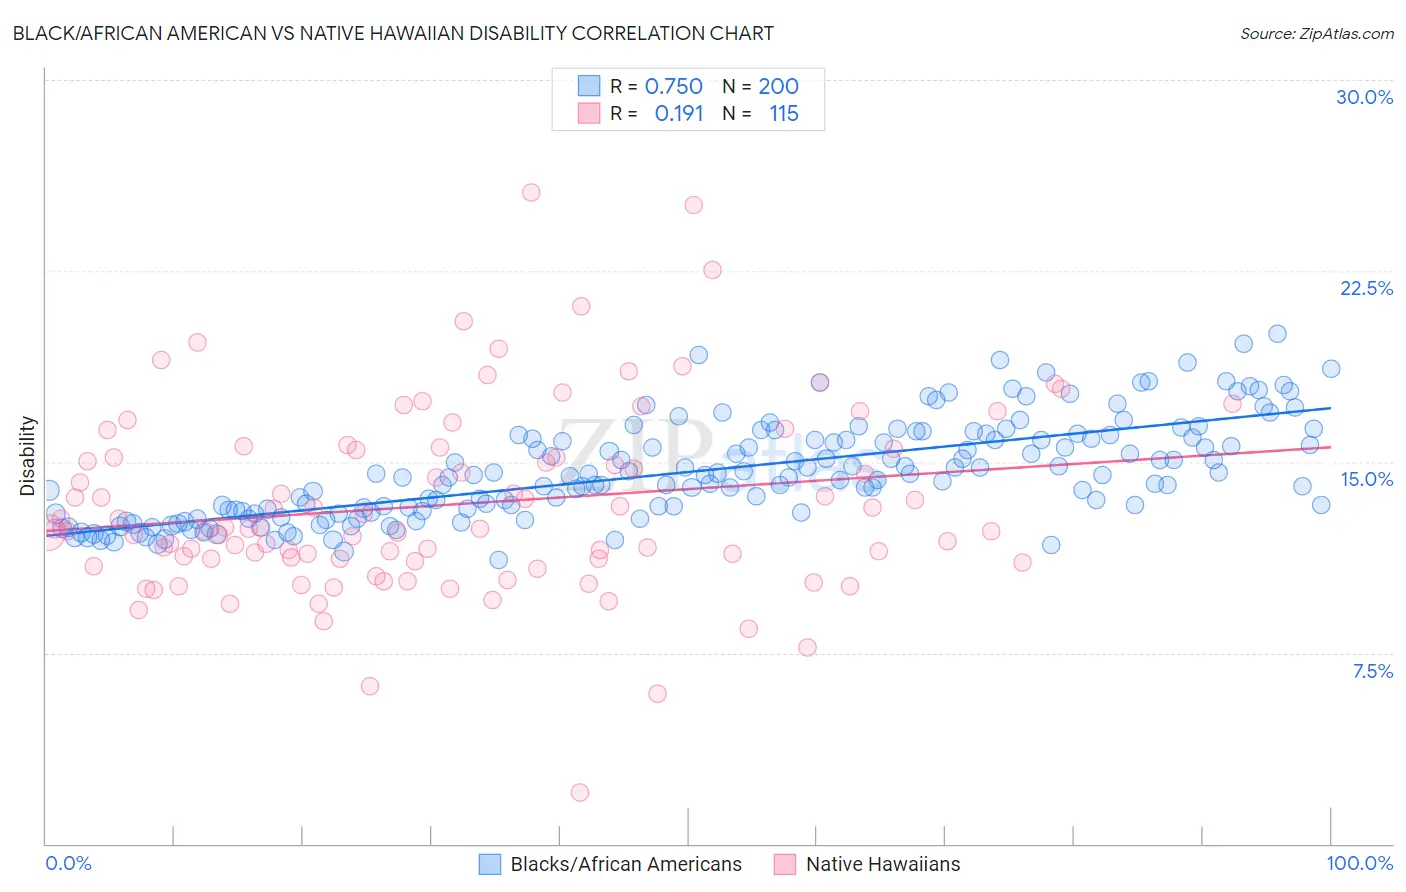
Black/African American vs Native Hawaiian Disability Correlation Chart
The statistical analysis conducted on geographies consisting of 565,891,121 people shows a strong positive correlation between the proportion of Blacks/African Americans and percentage of population with a disability in the United States with a correlation coefficient (R) of 0.750 and weighted average of 13.7%. Similarly, the statistical analysis conducted on geographies consisting of 332,036,989 people shows a poor positive correlation between the proportion of Native Hawaiians and percentage of population with a disability in the United States with a correlation coefficient (R) of 0.191 and weighted average of 12.5%, a difference of 10.0%.
Disability Correlation Summary
| Measurement | Black/African American | Native Hawaiian |
| Minimum | 11.1% | 2.0% |
| Maximum | 20.0% | 25.6% |
| Range | 8.9% | 23.6% |
| Mean | 14.6% | 13.3% |
| Median | 14.4% | 12.4% |
| Interquartile 25% (IQ1) | 13.0% | 11.2% |
| Interquartile 75% (IQ3) | 15.9% | 15.5% |
| Interquartile Range (IQR) | 2.9% | 4.4% |
| Standard Deviation (Sample) | 1.9% | 3.7% |
| Standard Deviation (Population) | 1.9% | 3.7% |
Similar Demographics by Disability
Demographics Similar to Blacks/African Americans by Disability
In terms of disability, the demographic groups most similar to Blacks/African Americans are Puget Sound Salish (13.7%, a difference of 0.0%), Pima (13.7%, a difference of 0.030%), Immigrants from Cabo Verde (13.7%, a difference of 0.030%), Cree (13.7%, a difference of 0.040%), and Spanish American (13.6%, a difference of 0.39%).
| Demographics | Rating | Rank | Disability |
| Shoshone | 0.0 /100 | #307 | Tragic 13.5% |
| French American Indians | 0.0 /100 | #308 | Tragic 13.5% |
| Tlingit-Haida | 0.0 /100 | #309 | Tragic 13.5% |
| Blackfeet | 0.0 /100 | #310 | Tragic 13.6% |
| Delaware | 0.0 /100 | #311 | Tragic 13.6% |
| Spanish Americans | 0.0 /100 | #312 | Tragic 13.6% |
| Cree | 0.0 /100 | #313 | Tragic 13.7% |
| Blacks/African Americans | 0.0 /100 | #314 | Tragic 13.7% |
| Puget Sound Salish | 0.0 /100 | #315 | Tragic 13.7% |
| Pima | 0.0 /100 | #316 | Tragic 13.7% |
| Immigrants | Cabo Verde | 0.0 /100 | #317 | Tragic 13.7% |
| Menominee | 0.0 /100 | #318 | Tragic 13.8% |
| Iroquois | 0.0 /100 | #319 | Tragic 13.8% |
| Apache | 0.0 /100 | #320 | Tragic 13.9% |
| Paiute | 0.0 /100 | #321 | Tragic 13.9% |
Demographics Similar to Native Hawaiians by Disability
In terms of disability, the demographic groups most similar to Native Hawaiians are Hawaiian (12.5%, a difference of 0.20%), Scandinavian (12.4%, a difference of 0.27%), Immigrants from Germany (12.5%, a difference of 0.32%), U.S. Virgin Islander (12.5%, a difference of 0.33%), and Immigrants from Liberia (12.4%, a difference of 0.34%).
| Demographics | Rating | Rank | Disability |
| Slovenes | 0.6 /100 | #255 | Tragic 12.4% |
| Immigrants | Dominica | 0.6 /100 | #256 | Tragic 12.4% |
| Immigrants | Laos | 0.5 /100 | #257 | Tragic 12.4% |
| Slavs | 0.5 /100 | #258 | Tragic 12.4% |
| Canadians | 0.4 /100 | #259 | Tragic 12.4% |
| Immigrants | Liberia | 0.4 /100 | #260 | Tragic 12.4% |
| Scandinavians | 0.4 /100 | #261 | Tragic 12.4% |
| Native Hawaiians | 0.3 /100 | #262 | Tragic 12.5% |
| Hawaiians | 0.2 /100 | #263 | Tragic 12.5% |
| Immigrants | Germany | 0.2 /100 | #264 | Tragic 12.5% |
| U.S. Virgin Islanders | 0.2 /100 | #265 | Tragic 12.5% |
| Czechoslovakians | 0.2 /100 | #266 | Tragic 12.5% |
| Spaniards | 0.2 /100 | #267 | Tragic 12.5% |
| Bangladeshis | 0.1 /100 | #268 | Tragic 12.6% |
| Immigrants | Dominican Republic | 0.1 /100 | #269 | Tragic 12.6% |