Israeli vs Native Hawaiian Disability
COMPARE
Israeli
Native Hawaiian
Disability
Disability Comparison
Israelis
Native Hawaiians
10.8%
DISABILITY
99.9/ 100
METRIC RATING
43rd/ 347
METRIC RANK
12.5%
DISABILITY
0.3/ 100
METRIC RATING
262nd/ 347
METRIC RANK
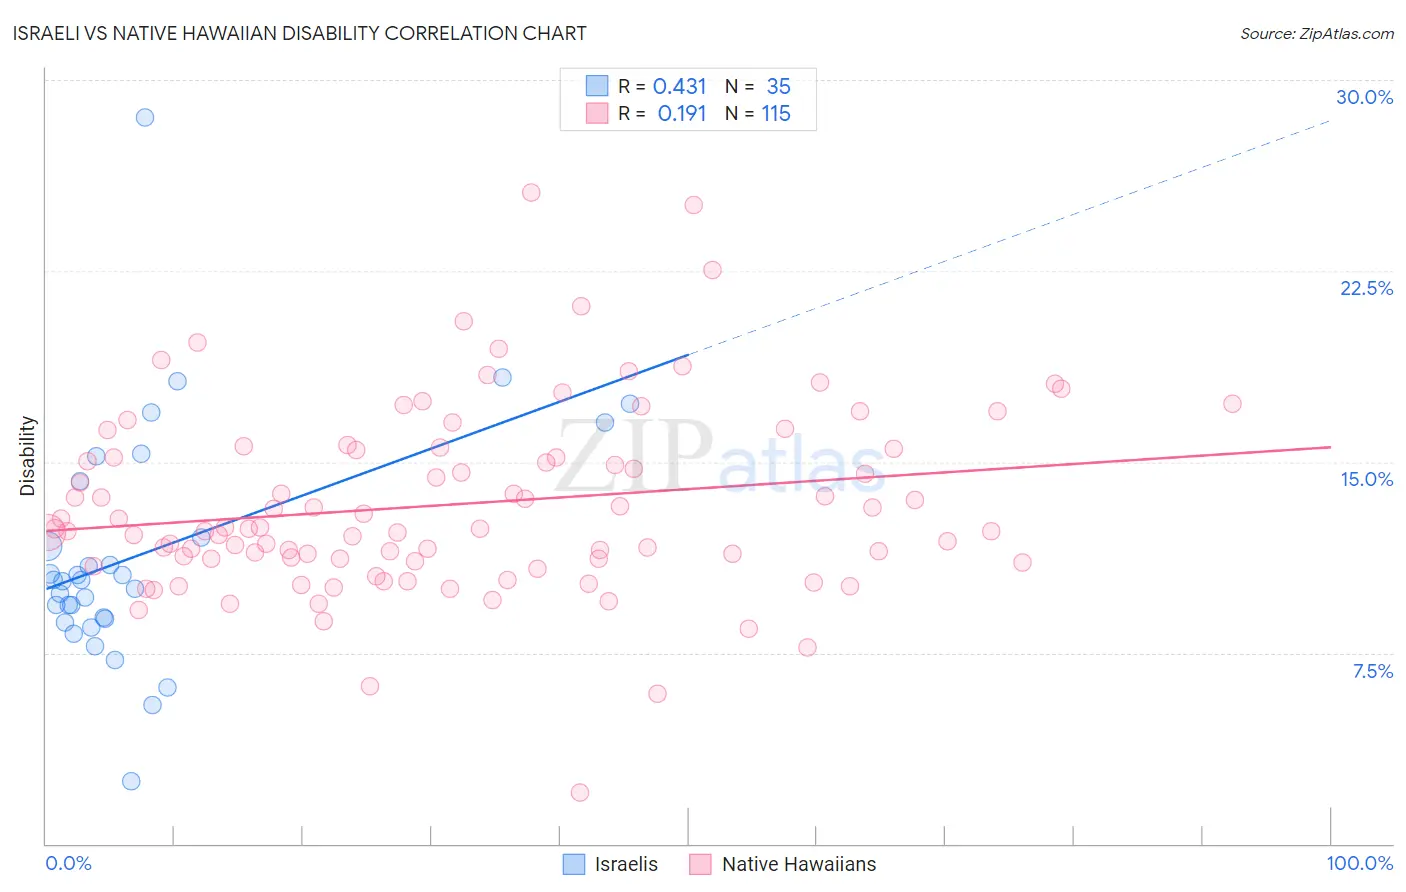
Israeli vs Native Hawaiian Disability Correlation Chart
The statistical analysis conducted on geographies consisting of 211,184,121 people shows a moderate positive correlation between the proportion of Israelis and percentage of population with a disability in the United States with a correlation coefficient (R) of 0.431 and weighted average of 10.8%. Similarly, the statistical analysis conducted on geographies consisting of 332,036,989 people shows a poor positive correlation between the proportion of Native Hawaiians and percentage of population with a disability in the United States with a correlation coefficient (R) of 0.191 and weighted average of 12.5%, a difference of 15.4%.
Disability Correlation Summary
| Measurement | Israeli | Native Hawaiian |
| Minimum | 2.4% | 2.0% |
| Maximum | 28.5% | 25.6% |
| Range | 26.1% | 23.6% |
| Mean | 11.4% | 13.3% |
| Median | 10.4% | 12.4% |
| Interquartile 25% (IQ1) | 8.9% | 11.2% |
| Interquartile 75% (IQ3) | 14.2% | 15.5% |
| Interquartile Range (IQR) | 5.4% | 4.4% |
| Standard Deviation (Sample) | 4.7% | 3.7% |
| Standard Deviation (Population) | 4.6% | 3.7% |
Similar Demographics by Disability
Demographics Similar to Israelis by Disability
In terms of disability, the demographic groups most similar to Israelis are Immigrants from Nepal (10.8%, a difference of 0.050%), Immigrants from Japan (10.8%, a difference of 0.10%), Immigrants from Australia (10.8%, a difference of 0.15%), Cambodian (10.8%, a difference of 0.19%), and Mongolian (10.8%, a difference of 0.19%).
| Demographics | Rating | Rank | Disability |
| Ethiopians | 100.0 /100 | #36 | Exceptional 10.7% |
| Turks | 100.0 /100 | #37 | Exceptional 10.7% |
| Afghans | 99.9 /100 | #38 | Exceptional 10.8% |
| Cambodians | 99.9 /100 | #39 | Exceptional 10.8% |
| Mongolians | 99.9 /100 | #40 | Exceptional 10.8% |
| Immigrants | Australia | 99.9 /100 | #41 | Exceptional 10.8% |
| Immigrants | Nepal | 99.9 /100 | #42 | Exceptional 10.8% |
| Israelis | 99.9 /100 | #43 | Exceptional 10.8% |
| Immigrants | Japan | 99.9 /100 | #44 | Exceptional 10.8% |
| Immigrants | Peru | 99.9 /100 | #45 | Exceptional 10.8% |
| Tongans | 99.9 /100 | #46 | Exceptional 10.8% |
| Taiwanese | 99.9 /100 | #47 | Exceptional 10.8% |
| Soviet Union | 99.9 /100 | #48 | Exceptional 10.9% |
| Vietnamese | 99.9 /100 | #49 | Exceptional 10.9% |
| Immigrants | Saudi Arabia | 99.9 /100 | #50 | Exceptional 10.9% |
Demographics Similar to Native Hawaiians by Disability
In terms of disability, the demographic groups most similar to Native Hawaiians are Hawaiian (12.5%, a difference of 0.20%), Scandinavian (12.4%, a difference of 0.27%), Immigrants from Germany (12.5%, a difference of 0.32%), U.S. Virgin Islander (12.5%, a difference of 0.33%), and Immigrants from Liberia (12.4%, a difference of 0.34%).
| Demographics | Rating | Rank | Disability |
| Slovenes | 0.6 /100 | #255 | Tragic 12.4% |
| Immigrants | Dominica | 0.6 /100 | #256 | Tragic 12.4% |
| Immigrants | Laos | 0.5 /100 | #257 | Tragic 12.4% |
| Slavs | 0.5 /100 | #258 | Tragic 12.4% |
| Canadians | 0.4 /100 | #259 | Tragic 12.4% |
| Immigrants | Liberia | 0.4 /100 | #260 | Tragic 12.4% |
| Scandinavians | 0.4 /100 | #261 | Tragic 12.4% |
| Native Hawaiians | 0.3 /100 | #262 | Tragic 12.5% |
| Hawaiians | 0.2 /100 | #263 | Tragic 12.5% |
| Immigrants | Germany | 0.2 /100 | #264 | Tragic 12.5% |
| U.S. Virgin Islanders | 0.2 /100 | #265 | Tragic 12.5% |
| Czechoslovakians | 0.2 /100 | #266 | Tragic 12.5% |
| Spaniards | 0.2 /100 | #267 | Tragic 12.5% |
| Bangladeshis | 0.1 /100 | #268 | Tragic 12.6% |
| Immigrants | Dominican Republic | 0.1 /100 | #269 | Tragic 12.6% |