Lumbee vs Immigrants from Cuba Disability
COMPARE
Lumbee
Immigrants from Cuba
Disability
Disability Comparison
Lumbee
Immigrants from Cuba
15.5%
DISABILITY
0.0/ 100
METRIC RATING
341st/ 347
METRIC RANK
11.6%
DISABILITY
62.8/ 100
METRIC RATING
161st/ 347
METRIC RANK
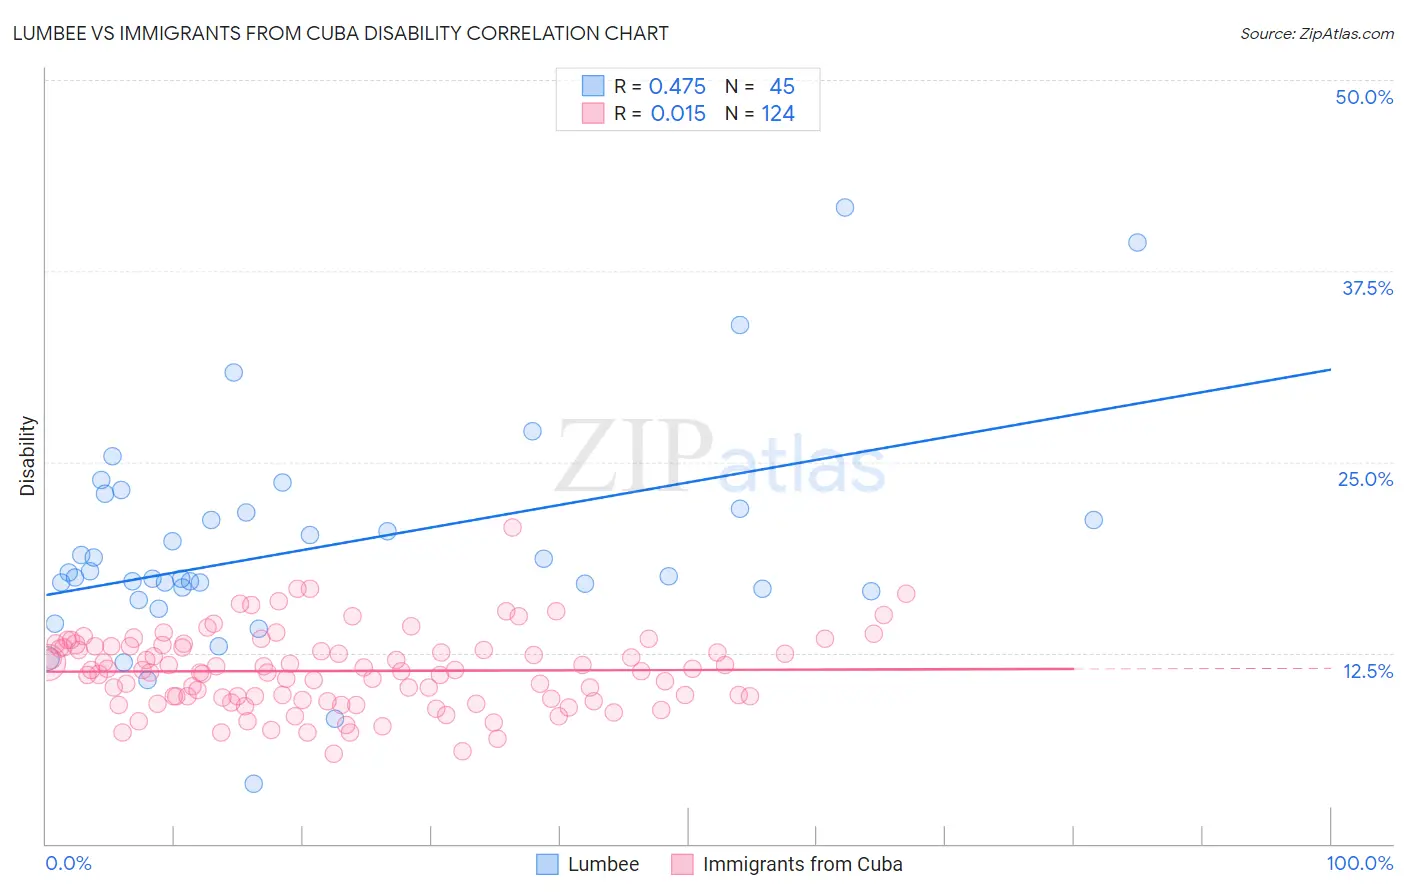
Lumbee vs Immigrants from Cuba Disability Correlation Chart
The statistical analysis conducted on geographies consisting of 92,289,178 people shows a moderate positive correlation between the proportion of Lumbee and percentage of population with a disability in the United States with a correlation coefficient (R) of 0.475 and weighted average of 15.5%. Similarly, the statistical analysis conducted on geographies consisting of 325,999,543 people shows no correlation between the proportion of Immigrants from Cuba and percentage of population with a disability in the United States with a correlation coefficient (R) of 0.015 and weighted average of 11.6%, a difference of 33.5%.
Disability Correlation Summary
| Measurement | Lumbee | Immigrants from Cuba |
| Minimum | 3.9% | 5.9% |
| Maximum | 41.7% | 20.7% |
| Range | 37.8% | 14.8% |
| Mean | 19.4% | 11.3% |
| Median | 17.5% | 11.3% |
| Interquartile 25% (IQ1) | 16.6% | 9.6% |
| Interquartile 75% (IQ3) | 21.8% | 12.9% |
| Interquartile Range (IQR) | 5.2% | 3.3% |
| Standard Deviation (Sample) | 7.0% | 2.5% |
| Standard Deviation (Population) | 6.9% | 2.5% |
Similar Demographics by Disability
Demographics Similar to Lumbee by Disability
In terms of disability, the demographic groups most similar to Lumbee are Kiowa (15.6%, a difference of 0.45%), Creek (15.6%, a difference of 0.47%), Choctaw (15.4%, a difference of 0.84%), Colville (15.8%, a difference of 1.7%), and Chickasaw (15.2%, a difference of 2.3%).
| Demographics | Rating | Rank | Disability |
| Cajuns | 0.0 /100 | #333 | Tragic 14.6% |
| Yuman | 0.0 /100 | #334 | Tragic 14.6% |
| Tohono O'odham | 0.0 /100 | #335 | Tragic 14.8% |
| Cherokee | 0.0 /100 | #336 | Tragic 14.8% |
| Seminole | 0.0 /100 | #337 | Tragic 14.9% |
| Dutch West Indians | 0.0 /100 | #338 | Tragic 14.9% |
| Chickasaw | 0.0 /100 | #339 | Tragic 15.2% |
| Choctaw | 0.0 /100 | #340 | Tragic 15.4% |
| Lumbee | 0.0 /100 | #341 | Tragic 15.5% |
| Kiowa | 0.0 /100 | #342 | Tragic 15.6% |
| Creek | 0.0 /100 | #343 | Tragic 15.6% |
| Colville | 0.0 /100 | #344 | Tragic 15.8% |
| Puerto Ricans | 0.0 /100 | #345 | Tragic 16.1% |
| Tsimshian | 0.0 /100 | #346 | Tragic 16.1% |
| Houma | 0.0 /100 | #347 | Tragic 17.1% |
Demographics Similar to Immigrants from Cuba by Disability
In terms of disability, the demographic groups most similar to Immigrants from Cuba are Immigrants from Barbados (11.6%, a difference of 0.070%), Guatemalan (11.6%, a difference of 0.11%), Armenian (11.6%, a difference of 0.15%), Immigrants from Haiti (11.7%, a difference of 0.17%), and Immigrants from Trinidad and Tobago (11.7%, a difference of 0.19%).
| Demographics | Rating | Rank | Disability |
| Immigrants | Guatemala | 71.1 /100 | #154 | Good 11.6% |
| Immigrants | Netherlands | 69.8 /100 | #155 | Good 11.6% |
| Immigrants | Fiji | 69.5 /100 | #156 | Good 11.6% |
| Immigrants | Middle Africa | 69.5 /100 | #157 | Good 11.6% |
| Armenians | 65.9 /100 | #158 | Good 11.6% |
| Guatemalans | 65.1 /100 | #159 | Good 11.6% |
| Immigrants | Barbados | 64.2 /100 | #160 | Good 11.6% |
| Immigrants | Cuba | 62.8 /100 | #161 | Good 11.6% |
| Immigrants | Haiti | 59.2 /100 | #162 | Average 11.7% |
| Immigrants | Trinidad and Tobago | 58.9 /100 | #163 | Average 11.7% |
| Syrians | 58.5 /100 | #164 | Average 11.7% |
| Cubans | 56.7 /100 | #165 | Average 11.7% |
| Pakistanis | 54.7 /100 | #166 | Average 11.7% |
| Estonians | 54.4 /100 | #167 | Average 11.7% |
| Immigrants | Latin America | 54.1 /100 | #168 | Average 11.7% |