Pima vs Native/Alaskan Hearing Disability
COMPARE
Pima
Native/Alaskan
Hearing Disability
Hearing Disability Comparison
Pima
Natives/Alaskans
3.7%
HEARING DISABILITY
0.0/ 100
METRIC RATING
296th/ 347
METRIC RANK
4.2%
HEARING DISABILITY
0.0/ 100
METRIC RATING
330th/ 347
METRIC RANK
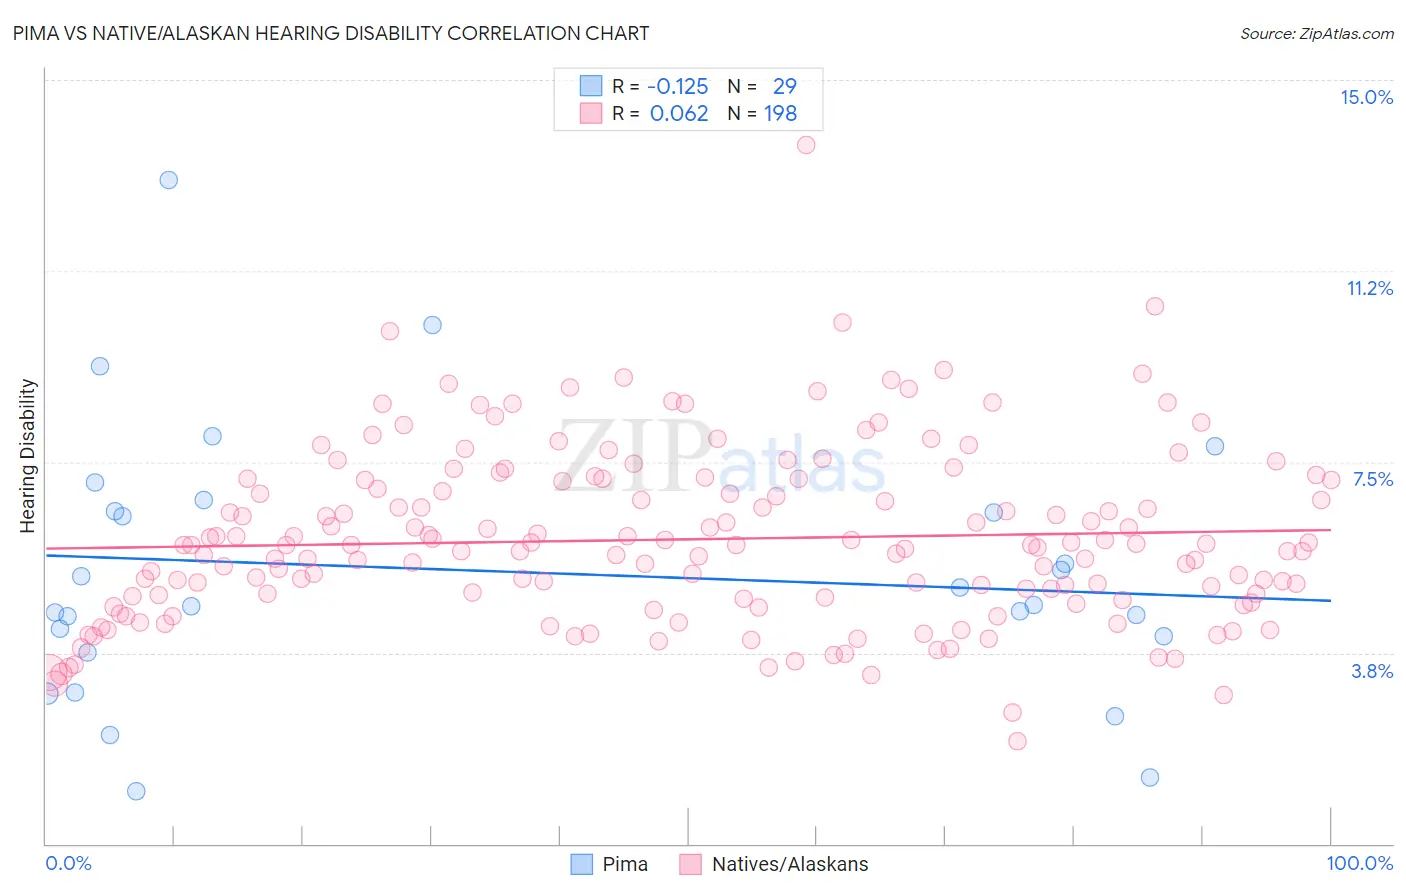
Pima vs Native/Alaskan Hearing Disability Correlation Chart
The statistical analysis conducted on geographies consisting of 61,536,530 people shows a poor negative correlation between the proportion of Pima and percentage of population with hearing disability in the United States with a correlation coefficient (R) of -0.125 and weighted average of 3.7%. Similarly, the statistical analysis conducted on geographies consisting of 512,663,343 people shows a slight positive correlation between the proportion of Natives/Alaskans and percentage of population with hearing disability in the United States with a correlation coefficient (R) of 0.062 and weighted average of 4.2%, a difference of 13.1%.
Hearing Disability Correlation Summary
| Measurement | Pima | Native/Alaskan |
| Minimum | 1.0% | 2.0% |
| Maximum | 13.0% | 13.7% |
| Range | 12.0% | 11.7% |
| Mean | 5.4% | 6.0% |
| Median | 4.7% | 5.9% |
| Interquartile 25% (IQ1) | 3.9% | 4.8% |
| Interquartile 75% (IQ3) | 6.6% | 7.2% |
| Interquartile Range (IQR) | 2.7% | 2.3% |
| Standard Deviation (Sample) | 2.6% | 1.7% |
| Standard Deviation (Population) | 2.6% | 1.7% |
Similar Demographics by Hearing Disability
Demographics Similar to Pima by Hearing Disability
In terms of hearing disability, the demographic groups most similar to Pima are Immigrants from the Azores (3.7%, a difference of 0.070%), Welsh (3.7%, a difference of 0.13%), Celtic (3.7%, a difference of 0.26%), Iroquois (3.7%, a difference of 0.39%), and German (3.7%, a difference of 0.54%).
| Demographics | Rating | Rank | Hearing Disability |
| Chinese | 0.0 /100 | #289 | Tragic 3.7% |
| Whites/Caucasians | 0.0 /100 | #290 | Tragic 3.7% |
| Finns | 0.0 /100 | #291 | Tragic 3.7% |
| Native Hawaiians | 0.0 /100 | #292 | Tragic 3.7% |
| Norwegians | 0.0 /100 | #293 | Tragic 3.7% |
| Iroquois | 0.0 /100 | #294 | Tragic 3.7% |
| Welsh | 0.0 /100 | #295 | Tragic 3.7% |
| Pima | 0.0 /100 | #296 | Tragic 3.7% |
| Immigrants | Azores | 0.0 /100 | #297 | Tragic 3.7% |
| Celtics | 0.0 /100 | #298 | Tragic 3.7% |
| Germans | 0.0 /100 | #299 | Tragic 3.7% |
| Scottish | 0.0 /100 | #300 | Tragic 3.7% |
| Pennsylvania Germans | 0.0 /100 | #301 | Tragic 3.7% |
| Dutch | 0.0 /100 | #302 | Tragic 3.7% |
| Menominee | 0.0 /100 | #303 | Tragic 3.7% |
Demographics Similar to Natives/Alaskans by Hearing Disability
In terms of hearing disability, the demographic groups most similar to Natives/Alaskans are Cherokee (4.2%, a difference of 0.15%), Crow (4.2%, a difference of 0.79%), Tohono O'odham (4.2%, a difference of 0.80%), Houma (4.2%, a difference of 0.83%), and Arapaho (4.1%, a difference of 1.2%).
| Demographics | Rating | Rank | Hearing Disability |
| Apache | 0.0 /100 | #323 | Tragic 4.1% |
| Osage | 0.0 /100 | #324 | Tragic 4.1% |
| Lumbee | 0.0 /100 | #325 | Tragic 4.1% |
| Potawatomi | 0.0 /100 | #326 | Tragic 4.1% |
| Arapaho | 0.0 /100 | #327 | Tragic 4.1% |
| Tohono O'odham | 0.0 /100 | #328 | Tragic 4.2% |
| Crow | 0.0 /100 | #329 | Tragic 4.2% |
| Natives/Alaskans | 0.0 /100 | #330 | Tragic 4.2% |
| Cherokee | 0.0 /100 | #331 | Tragic 4.2% |
| Houma | 0.0 /100 | #332 | Tragic 4.2% |
| Dutch West Indians | 0.0 /100 | #333 | Tragic 4.3% |
| Aleuts | 0.0 /100 | #334 | Tragic 4.3% |
| Kiowa | 0.0 /100 | #335 | Tragic 4.3% |
| Creek | 0.0 /100 | #336 | Tragic 4.4% |
| Chickasaw | 0.0 /100 | #337 | Tragic 4.5% |