Lumbee vs Ute Hearing Disability
COMPARE
Lumbee
Ute
Hearing Disability
Hearing Disability Comparison
Lumbee
Ute
4.1%
HEARING DISABILITY
0.0/ 100
METRIC RATING
325th/ 347
METRIC RANK
3.5%
HEARING DISABILITY
0.1/ 100
METRIC RATING
269th/ 347
METRIC RANK
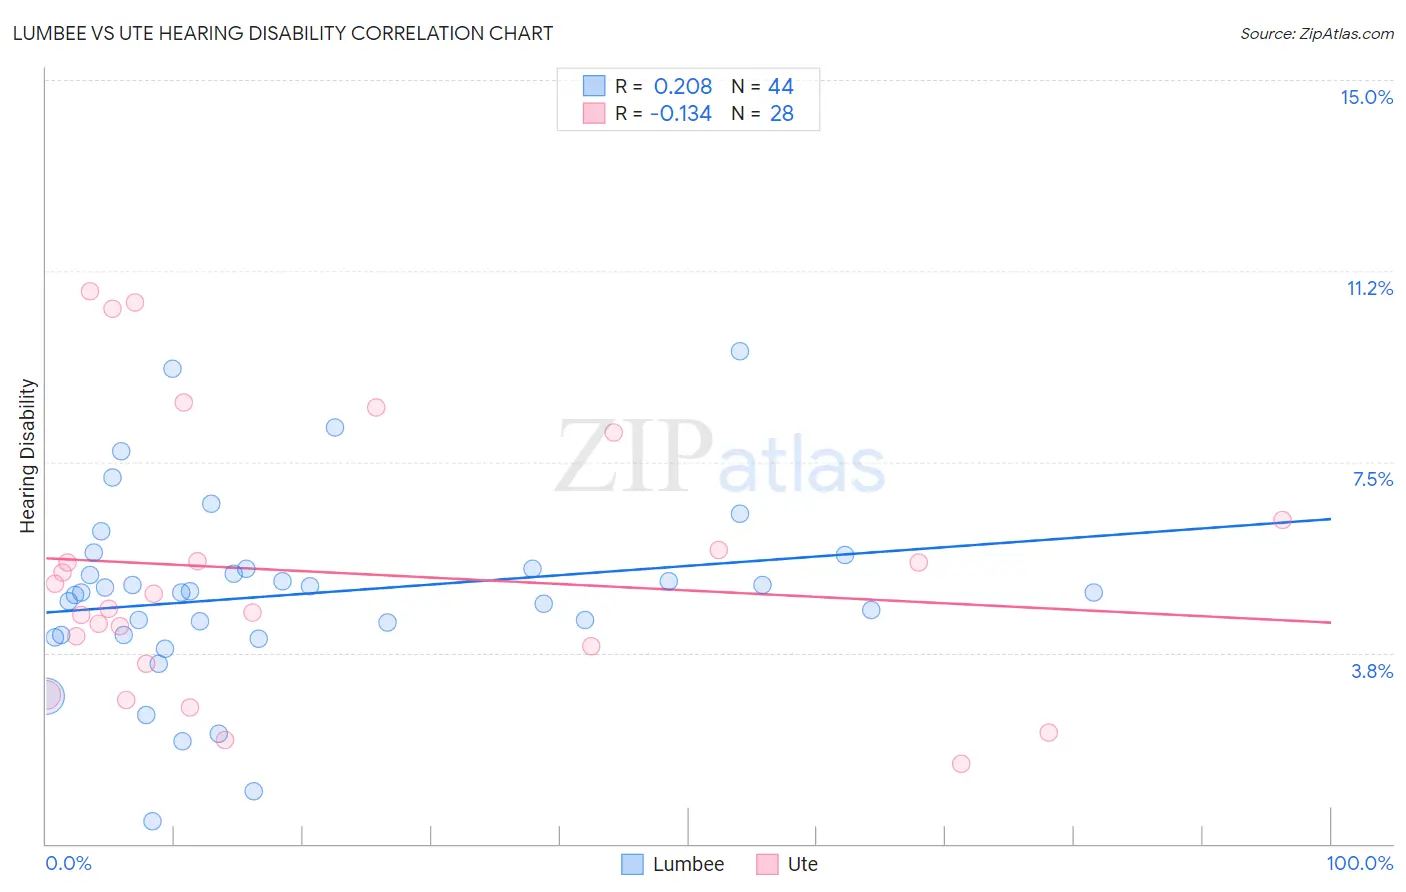
Lumbee vs Ute Hearing Disability Correlation Chart
The statistical analysis conducted on geographies consisting of 92,274,524 people shows a weak positive correlation between the proportion of Lumbee and percentage of population with hearing disability in the United States with a correlation coefficient (R) of 0.208 and weighted average of 4.1%. Similarly, the statistical analysis conducted on geographies consisting of 55,656,713 people shows a poor negative correlation between the proportion of Ute and percentage of population with hearing disability in the United States with a correlation coefficient (R) of -0.134 and weighted average of 3.5%, a difference of 17.4%.
Hearing Disability Correlation Summary
| Measurement | Lumbee | Ute |
| Minimum | 0.45% | 1.6% |
| Maximum | 9.7% | 10.9% |
| Range | 9.2% | 9.3% |
| Mean | 4.9% | 5.3% |
| Median | 4.9% | 4.8% |
| Interquartile 25% (IQ1) | 4.1% | 3.7% |
| Interquartile 75% (IQ3) | 5.4% | 6.1% |
| Interquartile Range (IQR) | 1.3% | 2.3% |
| Standard Deviation (Sample) | 1.8% | 2.6% |
| Standard Deviation (Population) | 1.8% | 2.5% |
Similar Demographics by Hearing Disability
Demographics Similar to Lumbee by Hearing Disability
In terms of hearing disability, the demographic groups most similar to Lumbee are Potawatomi (4.1%, a difference of 0.29%), Osage (4.1%, a difference of 0.32%), Apache (4.1%, a difference of 0.39%), Seminole (4.1%, a difference of 0.51%), and Paiute (4.1%, a difference of 0.77%).
| Demographics | Rating | Rank | Hearing Disability |
| Cheyenne | 0.0 /100 | #318 | Tragic 4.0% |
| Chippewa | 0.0 /100 | #319 | Tragic 4.0% |
| Shoshone | 0.0 /100 | #320 | Tragic 4.0% |
| Paiute | 0.0 /100 | #321 | Tragic 4.1% |
| Seminole | 0.0 /100 | #322 | Tragic 4.1% |
| Apache | 0.0 /100 | #323 | Tragic 4.1% |
| Osage | 0.0 /100 | #324 | Tragic 4.1% |
| Lumbee | 0.0 /100 | #325 | Tragic 4.1% |
| Potawatomi | 0.0 /100 | #326 | Tragic 4.1% |
| Arapaho | 0.0 /100 | #327 | Tragic 4.1% |
| Tohono O'odham | 0.0 /100 | #328 | Tragic 4.2% |
| Crow | 0.0 /100 | #329 | Tragic 4.2% |
| Natives/Alaskans | 0.0 /100 | #330 | Tragic 4.2% |
| Cherokee | 0.0 /100 | #331 | Tragic 4.2% |
| Houma | 0.0 /100 | #332 | Tragic 4.2% |
Demographics Similar to Ute by Hearing Disability
In terms of hearing disability, the demographic groups most similar to Ute are Spaniard (3.5%, a difference of 0.30%), Canadian (3.5%, a difference of 0.32%), European (3.5%, a difference of 0.35%), Belgian (3.5%, a difference of 0.54%), and Czech (3.5%, a difference of 0.61%).
| Demographics | Rating | Rank | Hearing Disability |
| Immigrants | North America | 0.1 /100 | #262 | Tragic 3.5% |
| Immigrants | Canada | 0.1 /100 | #263 | Tragic 3.5% |
| Immigrants | Germany | 0.1 /100 | #264 | Tragic 3.5% |
| British | 0.1 /100 | #265 | Tragic 3.5% |
| Belgians | 0.1 /100 | #266 | Tragic 3.5% |
| Canadians | 0.1 /100 | #267 | Tragic 3.5% |
| Spaniards | 0.1 /100 | #268 | Tragic 3.5% |
| Ute | 0.1 /100 | #269 | Tragic 3.5% |
| Europeans | 0.1 /100 | #270 | Tragic 3.5% |
| Czechs | 0.1 /100 | #271 | Tragic 3.5% |
| Fijians | 0.0 /100 | #272 | Tragic 3.5% |
| Puerto Ricans | 0.0 /100 | #273 | Tragic 3.5% |
| Swiss | 0.0 /100 | #274 | Tragic 3.5% |
| Czechoslovakians | 0.0 /100 | #275 | Tragic 3.6% |
| Danes | 0.0 /100 | #276 | Tragic 3.6% |