Lumbee vs Immigrants from Nicaragua Hearing Disability
COMPARE
Lumbee
Immigrants from Nicaragua
Hearing Disability
Hearing Disability Comparison
Lumbee
Immigrants from Nicaragua
4.1%
HEARING DISABILITY
0.0/ 100
METRIC RATING
325th/ 347
METRIC RANK
2.7%
HEARING DISABILITY
99.0/ 100
METRIC RATING
56th/ 347
METRIC RANK
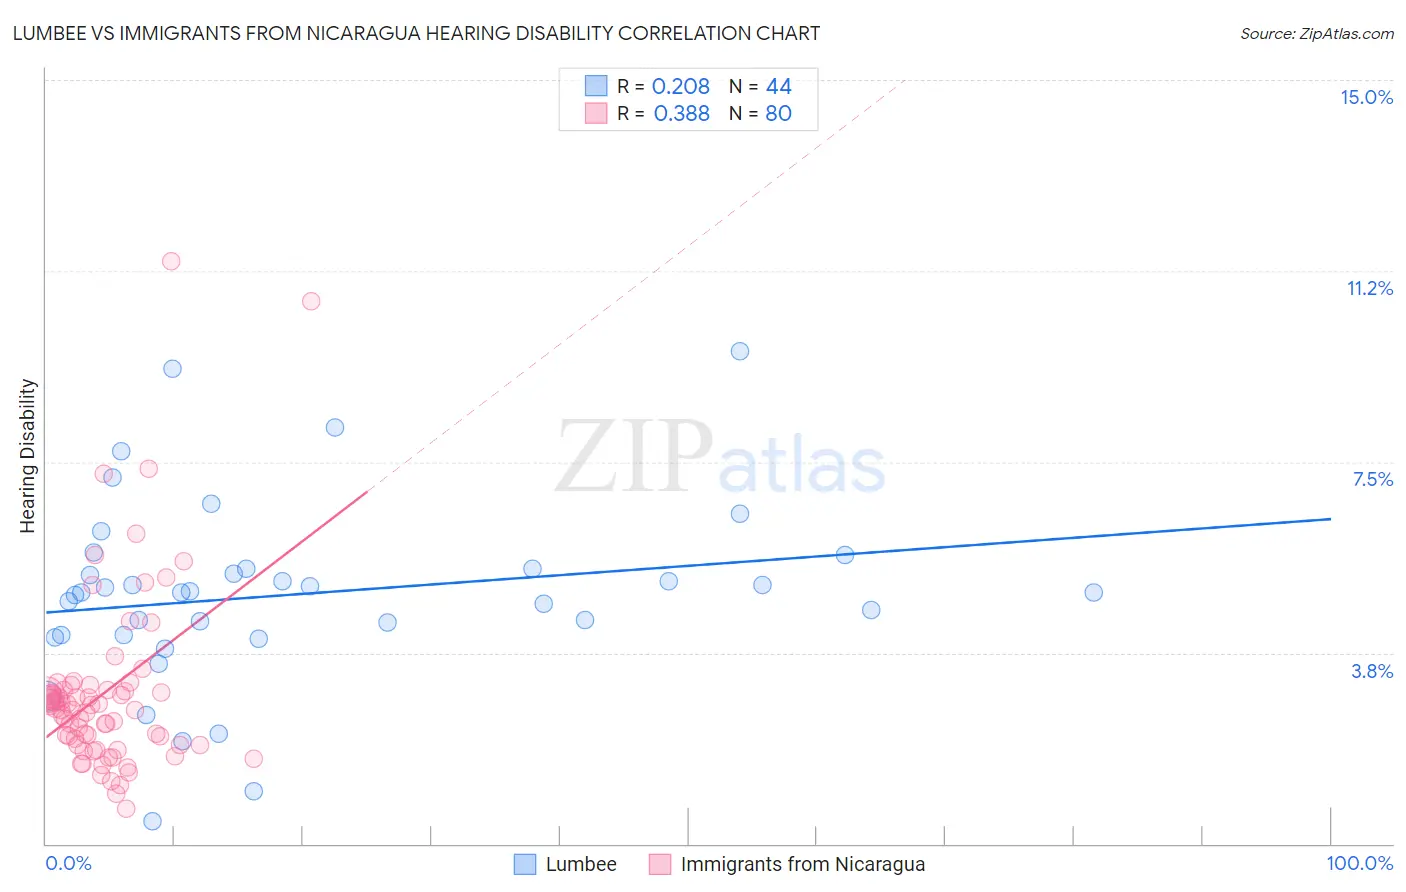
Lumbee vs Immigrants from Nicaragua Hearing Disability Correlation Chart
The statistical analysis conducted on geographies consisting of 92,274,524 people shows a weak positive correlation between the proportion of Lumbee and percentage of population with hearing disability in the United States with a correlation coefficient (R) of 0.208 and weighted average of 4.1%. Similarly, the statistical analysis conducted on geographies consisting of 236,296,931 people shows a mild positive correlation between the proportion of Immigrants from Nicaragua and percentage of population with hearing disability in the United States with a correlation coefficient (R) of 0.388 and weighted average of 2.7%, a difference of 53.6%.
Hearing Disability Correlation Summary
| Measurement | Lumbee | Immigrants from Nicaragua |
| Minimum | 0.45% | 0.69% |
| Maximum | 9.7% | 11.4% |
| Range | 9.2% | 10.7% |
| Mean | 4.9% | 3.0% |
| Median | 4.9% | 2.6% |
| Interquartile 25% (IQ1) | 4.1% | 1.9% |
| Interquartile 75% (IQ3) | 5.4% | 3.0% |
| Interquartile Range (IQR) | 1.3% | 1.1% |
| Standard Deviation (Sample) | 1.8% | 1.8% |
| Standard Deviation (Population) | 1.8% | 1.8% |
Similar Demographics by Hearing Disability
Demographics Similar to Lumbee by Hearing Disability
In terms of hearing disability, the demographic groups most similar to Lumbee are Potawatomi (4.1%, a difference of 0.29%), Osage (4.1%, a difference of 0.32%), Apache (4.1%, a difference of 0.39%), Seminole (4.1%, a difference of 0.51%), and Paiute (4.1%, a difference of 0.77%).
| Demographics | Rating | Rank | Hearing Disability |
| Cheyenne | 0.0 /100 | #318 | Tragic 4.0% |
| Chippewa | 0.0 /100 | #319 | Tragic 4.0% |
| Shoshone | 0.0 /100 | #320 | Tragic 4.0% |
| Paiute | 0.0 /100 | #321 | Tragic 4.1% |
| Seminole | 0.0 /100 | #322 | Tragic 4.1% |
| Apache | 0.0 /100 | #323 | Tragic 4.1% |
| Osage | 0.0 /100 | #324 | Tragic 4.1% |
| Lumbee | 0.0 /100 | #325 | Tragic 4.1% |
| Potawatomi | 0.0 /100 | #326 | Tragic 4.1% |
| Arapaho | 0.0 /100 | #327 | Tragic 4.1% |
| Tohono O'odham | 0.0 /100 | #328 | Tragic 4.2% |
| Crow | 0.0 /100 | #329 | Tragic 4.2% |
| Natives/Alaskans | 0.0 /100 | #330 | Tragic 4.2% |
| Cherokee | 0.0 /100 | #331 | Tragic 4.2% |
| Houma | 0.0 /100 | #332 | Tragic 4.2% |
Demographics Similar to Immigrants from Nicaragua by Hearing Disability
In terms of hearing disability, the demographic groups most similar to Immigrants from Nicaragua are Immigrants from Ethiopia (2.7%, a difference of 0.020%), South American (2.7%, a difference of 0.040%), Ethiopian (2.7%, a difference of 0.090%), Immigrants from Eastern Asia (2.7%, a difference of 0.12%), and Jamaican (2.7%, a difference of 0.19%).
| Demographics | Rating | Rank | Hearing Disability |
| Immigrants | South America | 99.2 /100 | #49 | Exceptional 2.7% |
| Paraguayans | 99.2 /100 | #50 | Exceptional 2.7% |
| Immigrants | Hong Kong | 99.2 /100 | #51 | Exceptional 2.7% |
| Jamaicans | 99.0 /100 | #52 | Exceptional 2.7% |
| Immigrants | Eastern Asia | 99.0 /100 | #53 | Exceptional 2.7% |
| Ethiopians | 99.0 /100 | #54 | Exceptional 2.7% |
| Immigrants | Ethiopia | 99.0 /100 | #55 | Exceptional 2.7% |
| Immigrants | Nicaragua | 99.0 /100 | #56 | Exceptional 2.7% |
| South Americans | 99.0 /100 | #57 | Exceptional 2.7% |
| Immigrants | Peru | 98.6 /100 | #58 | Exceptional 2.7% |
| Immigrants | Eritrea | 98.5 /100 | #59 | Exceptional 2.7% |
| Immigrants | Egypt | 98.5 /100 | #60 | Exceptional 2.7% |
| Immigrants | Uzbekistan | 98.4 /100 | #61 | Exceptional 2.7% |
| Immigrants | Colombia | 98.4 /100 | #62 | Exceptional 2.7% |
| Indians (Asian) | 98.4 /100 | #63 | Exceptional 2.7% |