Lithuanian vs Immigrants from Colombia Disability
COMPARE
Lithuanian
Immigrants from Colombia
Disability
Disability Comparison
Lithuanians
Immigrants from Colombia
11.9%
DISABILITY
18.8/ 100
METRIC RATING
192nd/ 347
METRIC RANK
10.9%
DISABILITY
99.7/ 100
METRIC RATING
59th/ 347
METRIC RANK
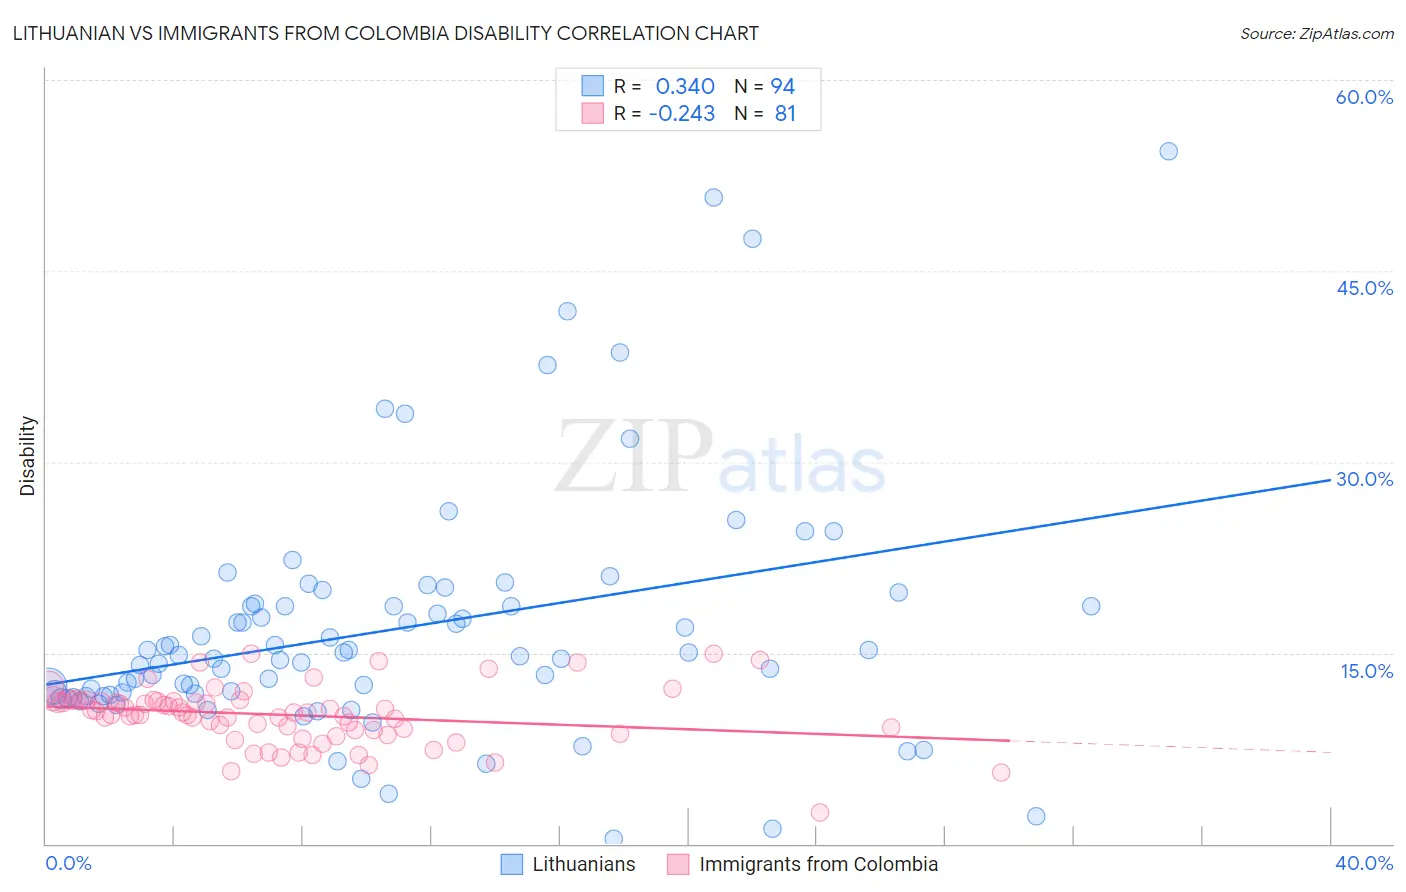
Lithuanian vs Immigrants from Colombia Disability Correlation Chart
The statistical analysis conducted on geographies consisting of 421,948,731 people shows a mild positive correlation between the proportion of Lithuanians and percentage of population with a disability in the United States with a correlation coefficient (R) of 0.340 and weighted average of 11.9%. Similarly, the statistical analysis conducted on geographies consisting of 378,650,675 people shows a weak negative correlation between the proportion of Immigrants from Colombia and percentage of population with a disability in the United States with a correlation coefficient (R) of -0.243 and weighted average of 10.9%, a difference of 8.8%.
Disability Correlation Summary
| Measurement | Lithuanian | Immigrants from Colombia |
| Minimum | 0.40% | 2.4% |
| Maximum | 54.4% | 14.9% |
| Range | 54.0% | 12.5% |
| Mean | 16.8% | 10.1% |
| Median | 14.8% | 10.3% |
| Interquartile 25% (IQ1) | 11.7% | 8.9% |
| Interquartile 75% (IQ3) | 18.7% | 11.2% |
| Interquartile Range (IQR) | 7.0% | 2.3% |
| Standard Deviation (Sample) | 9.6% | 2.3% |
| Standard Deviation (Population) | 9.6% | 2.3% |
Similar Demographics by Disability
Demographics Similar to Lithuanians by Disability
In terms of disability, the demographic groups most similar to Lithuanians are Ute (11.9%, a difference of 0.050%), Immigrants from Bosnia and Herzegovina (11.9%, a difference of 0.050%), Somali (11.9%, a difference of 0.11%), Immigrants from West Indies (11.9%, a difference of 0.16%), and Immigrants from Zaire (11.9%, a difference of 0.21%).
| Demographics | Rating | Rank | Disability |
| Immigrants | Burma/Myanmar | 28.5 /100 | #185 | Fair 11.8% |
| Immigrants | Scotland | 28.2 /100 | #186 | Fair 11.8% |
| Lebanese | 27.9 /100 | #187 | Fair 11.8% |
| Immigrants | Mexico | 23.8 /100 | #188 | Fair 11.9% |
| Immigrants | Zaire | 21.8 /100 | #189 | Fair 11.9% |
| Immigrants | West Indies | 21.1 /100 | #190 | Fair 11.9% |
| Ute | 19.5 /100 | #191 | Poor 11.9% |
| Lithuanians | 18.8 /100 | #192 | Poor 11.9% |
| Immigrants | Bosnia and Herzegovina | 18.0 /100 | #193 | Poor 11.9% |
| Somalis | 17.3 /100 | #194 | Poor 11.9% |
| Barbadians | 15.8 /100 | #195 | Poor 11.9% |
| Serbians | 15.4 /100 | #196 | Poor 11.9% |
| Immigrants | Belize | 15.2 /100 | #197 | Poor 11.9% |
| Ukrainians | 14.7 /100 | #198 | Poor 11.9% |
| Immigrants | Panama | 14.6 /100 | #199 | Poor 11.9% |
Demographics Similar to Immigrants from Colombia by Disability
In terms of disability, the demographic groups most similar to Immigrants from Colombia are Immigrants from South America (10.9%, a difference of 0.090%), Zimbabwean (10.9%, a difference of 0.090%), Salvadoran (10.9%, a difference of 0.12%), Immigrants from Bulgaria (10.9%, a difference of 0.15%), and Immigrants from Northern Africa (10.9%, a difference of 0.19%).
| Demographics | Rating | Rank | Disability |
| South Americans | 99.8 /100 | #52 | Exceptional 10.9% |
| Immigrants | Spain | 99.8 /100 | #53 | Exceptional 10.9% |
| Jordanians | 99.8 /100 | #54 | Exceptional 10.9% |
| Immigrants | El Salvador | 99.8 /100 | #55 | Exceptional 10.9% |
| Immigrants | Lithuania | 99.8 /100 | #56 | Exceptional 10.9% |
| Salvadorans | 99.8 /100 | #57 | Exceptional 10.9% |
| Immigrants | South America | 99.8 /100 | #58 | Exceptional 10.9% |
| Immigrants | Colombia | 99.7 /100 | #59 | Exceptional 10.9% |
| Zimbabweans | 99.7 /100 | #60 | Exceptional 10.9% |
| Immigrants | Bulgaria | 99.7 /100 | #61 | Exceptional 10.9% |
| Immigrants | Northern Africa | 99.7 /100 | #62 | Exceptional 10.9% |
| Immigrants | Eritrea | 99.7 /100 | #63 | Exceptional 11.0% |
| Immigrants | Sweden | 99.6 /100 | #64 | Exceptional 11.0% |
| Bulgarians | 99.6 /100 | #65 | Exceptional 11.0% |
| Laotians | 99.6 /100 | #66 | Exceptional 11.0% |