Lithuanian vs Bangladeshi Disability
COMPARE
Lithuanian
Bangladeshi
Disability
Disability Comparison
Lithuanians
Bangladeshis
11.9%
DISABILITY
18.8/ 100
METRIC RATING
192nd/ 347
METRIC RANK
12.6%
DISABILITY
0.1/ 100
METRIC RATING
268th/ 347
METRIC RANK
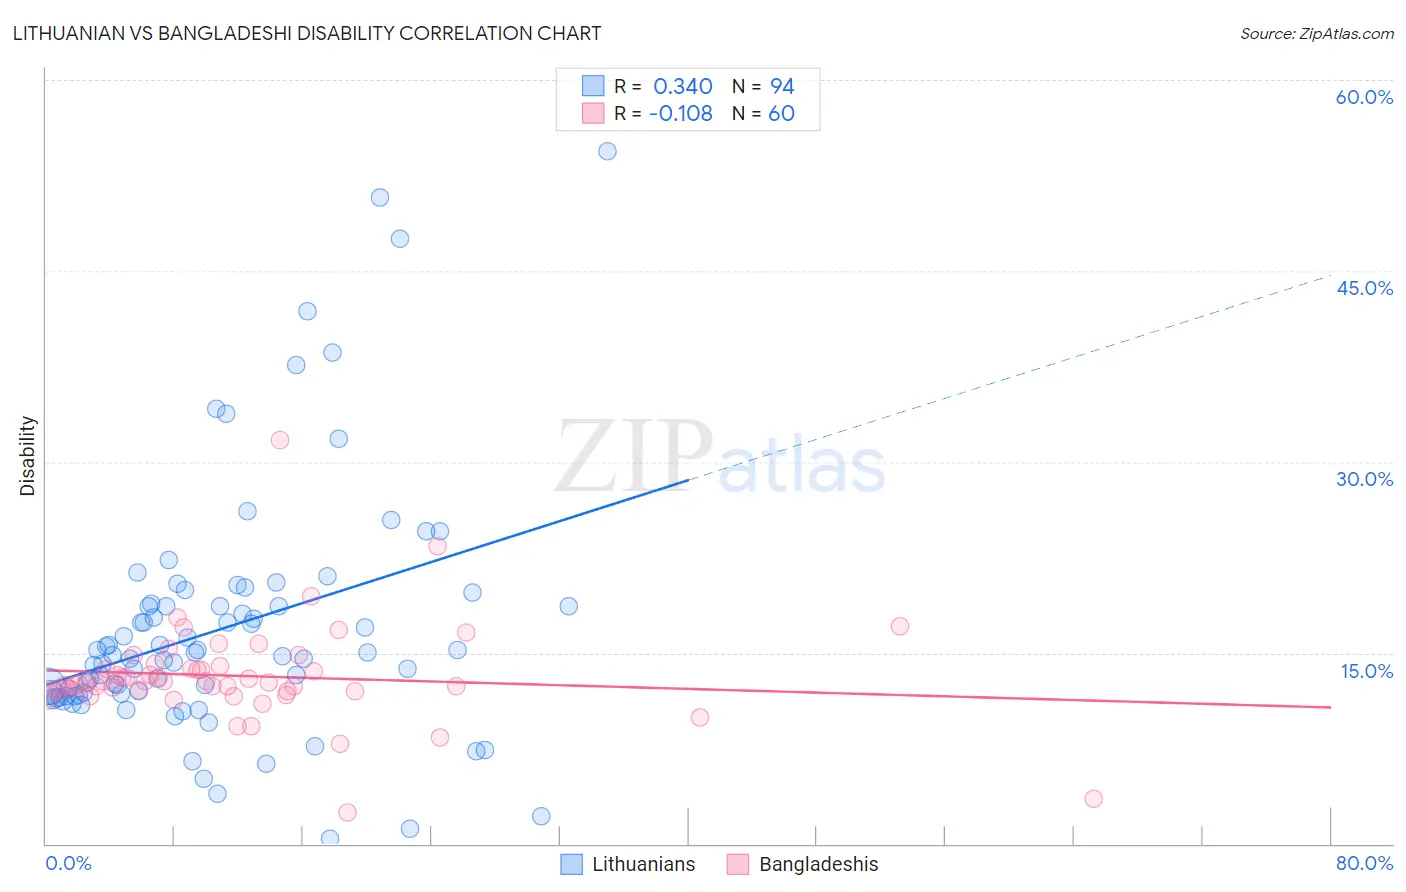
Lithuanian vs Bangladeshi Disability Correlation Chart
The statistical analysis conducted on geographies consisting of 421,948,731 people shows a mild positive correlation between the proportion of Lithuanians and percentage of population with a disability in the United States with a correlation coefficient (R) of 0.340 and weighted average of 11.9%. Similarly, the statistical analysis conducted on geographies consisting of 141,399,990 people shows a poor negative correlation between the proportion of Bangladeshis and percentage of population with a disability in the United States with a correlation coefficient (R) of -0.108 and weighted average of 12.6%, a difference of 5.7%.
Disability Correlation Summary
| Measurement | Lithuanian | Bangladeshi |
| Minimum | 0.40% | 2.4% |
| Maximum | 54.4% | 31.8% |
| Range | 54.0% | 29.3% |
| Mean | 16.8% | 13.2% |
| Median | 14.8% | 12.7% |
| Interquartile 25% (IQ1) | 11.7% | 12.0% |
| Interquartile 75% (IQ3) | 18.7% | 13.8% |
| Interquartile Range (IQR) | 7.0% | 1.8% |
| Standard Deviation (Sample) | 9.6% | 4.0% |
| Standard Deviation (Population) | 9.6% | 3.9% |
Similar Demographics by Disability
Demographics Similar to Lithuanians by Disability
In terms of disability, the demographic groups most similar to Lithuanians are Ute (11.9%, a difference of 0.050%), Immigrants from Bosnia and Herzegovina (11.9%, a difference of 0.050%), Somali (11.9%, a difference of 0.11%), Immigrants from West Indies (11.9%, a difference of 0.16%), and Immigrants from Zaire (11.9%, a difference of 0.21%).
| Demographics | Rating | Rank | Disability |
| Immigrants | Burma/Myanmar | 28.5 /100 | #185 | Fair 11.8% |
| Immigrants | Scotland | 28.2 /100 | #186 | Fair 11.8% |
| Lebanese | 27.9 /100 | #187 | Fair 11.8% |
| Immigrants | Mexico | 23.8 /100 | #188 | Fair 11.9% |
| Immigrants | Zaire | 21.8 /100 | #189 | Fair 11.9% |
| Immigrants | West Indies | 21.1 /100 | #190 | Fair 11.9% |
| Ute | 19.5 /100 | #191 | Poor 11.9% |
| Lithuanians | 18.8 /100 | #192 | Poor 11.9% |
| Immigrants | Bosnia and Herzegovina | 18.0 /100 | #193 | Poor 11.9% |
| Somalis | 17.3 /100 | #194 | Poor 11.9% |
| Barbadians | 15.8 /100 | #195 | Poor 11.9% |
| Serbians | 15.4 /100 | #196 | Poor 11.9% |
| Immigrants | Belize | 15.2 /100 | #197 | Poor 11.9% |
| Ukrainians | 14.7 /100 | #198 | Poor 11.9% |
| Immigrants | Panama | 14.6 /100 | #199 | Poor 11.9% |
Demographics Similar to Bangladeshis by Disability
In terms of disability, the demographic groups most similar to Bangladeshis are Immigrants from Dominican Republic (12.6%, a difference of 0.090%), Spaniard (12.5%, a difference of 0.33%), Czechoslovakian (12.5%, a difference of 0.40%), Portuguese (12.6%, a difference of 0.48%), and Immigrants from Yemen (12.6%, a difference of 0.53%).
| Demographics | Rating | Rank | Disability |
| Scandinavians | 0.4 /100 | #261 | Tragic 12.4% |
| Native Hawaiians | 0.3 /100 | #262 | Tragic 12.5% |
| Hawaiians | 0.2 /100 | #263 | Tragic 12.5% |
| Immigrants | Germany | 0.2 /100 | #264 | Tragic 12.5% |
| U.S. Virgin Islanders | 0.2 /100 | #265 | Tragic 12.5% |
| Czechoslovakians | 0.2 /100 | #266 | Tragic 12.5% |
| Spaniards | 0.2 /100 | #267 | Tragic 12.5% |
| Bangladeshis | 0.1 /100 | #268 | Tragic 12.6% |
| Immigrants | Dominican Republic | 0.1 /100 | #269 | Tragic 12.6% |
| Portuguese | 0.1 /100 | #270 | Tragic 12.6% |
| Immigrants | Yemen | 0.1 /100 | #271 | Tragic 12.6% |
| Dominicans | 0.0 /100 | #272 | Tragic 12.7% |
| Finns | 0.0 /100 | #273 | Tragic 12.7% |
| Nepalese | 0.0 /100 | #274 | Tragic 12.8% |
| Sioux | 0.0 /100 | #275 | Tragic 12.8% |