Assyrian/Chaldean/Syriac vs Indonesian Disability Age Under 5
COMPARE
Assyrian/Chaldean/Syriac
Indonesian
Disability Age Under 5
Disability Age Under 5 Comparison
Assyrians/Chaldeans/Syriacs
Indonesians
1.1%
DISABILITY AGE UNDER 5
99.5/ 100
METRIC RATING
57th/ 347
METRIC RANK
1.2%
DISABILITY AGE UNDER 5
95.9/ 100
METRIC RATING
104th/ 347
METRIC RANK
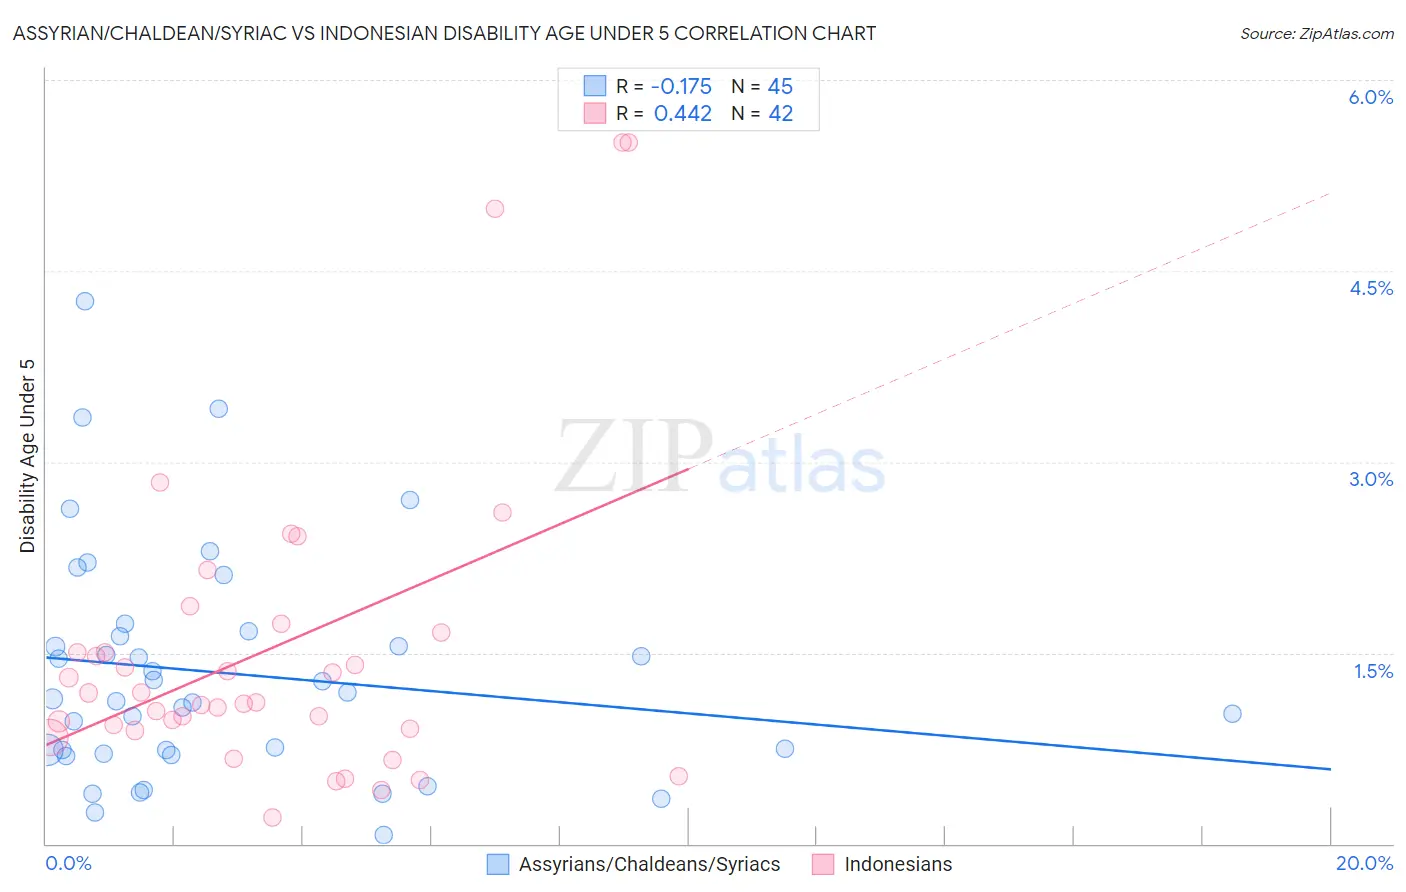
Assyrian/Chaldean/Syriac vs Indonesian Disability Age Under 5 Correlation Chart
The statistical analysis conducted on geographies consisting of 81,585,974 people shows a poor negative correlation between the proportion of Assyrians/Chaldeans/Syriacs and percentage of population with a disability under the age of 5 in the United States with a correlation coefficient (R) of -0.175 and weighted average of 1.1%. Similarly, the statistical analysis conducted on geographies consisting of 116,670,957 people shows a moderate positive correlation between the proportion of Indonesians and percentage of population with a disability under the age of 5 in the United States with a correlation coefficient (R) of 0.442 and weighted average of 1.2%, a difference of 5.3%.
Disability Age Under 5 Correlation Summary
| Measurement | Assyrian/Chaldean/Syriac | Indonesian |
| Minimum | 0.070% | 0.21% |
| Maximum | 4.3% | 5.5% |
| Range | 4.2% | 5.3% |
| Mean | 1.3% | 1.5% |
| Median | 1.1% | 1.1% |
| Interquartile 25% (IQ1) | 0.72% | 0.90% |
| Interquartile 75% (IQ3) | 1.6% | 1.7% |
| Interquartile Range (IQR) | 0.92% | 0.76% |
| Standard Deviation (Sample) | 0.90% | 1.2% |
| Standard Deviation (Population) | 0.89% | 1.2% |
Similar Demographics by Disability Age Under 5
Demographics Similar to Assyrians/Chaldeans/Syriacs by Disability Age Under 5
In terms of disability age under 5, the demographic groups most similar to Assyrians/Chaldeans/Syriacs are Ecuadorian (1.1%, a difference of 0.030%), Immigrants from Egypt (1.1%, a difference of 0.19%), Immigrants from Malaysia (1.1%, a difference of 0.30%), Salvadoran (1.1%, a difference of 0.42%), and Immigrants from El Salvador (1.1%, a difference of 0.52%).
| Demographics | Rating | Rank | Disability Age Under 5 |
| Immigrants | Japan | 99.7 /100 | #50 | Exceptional 1.1% |
| Immigrants | Kazakhstan | 99.7 /100 | #51 | Exceptional 1.1% |
| Immigrants | Bolivia | 99.6 /100 | #52 | Exceptional 1.1% |
| Asians | 99.6 /100 | #53 | Exceptional 1.1% |
| Immigrants | El Salvador | 99.6 /100 | #54 | Exceptional 1.1% |
| Salvadorans | 99.5 /100 | #55 | Exceptional 1.1% |
| Ecuadorians | 99.5 /100 | #56 | Exceptional 1.1% |
| Assyrians/Chaldeans/Syriacs | 99.5 /100 | #57 | Exceptional 1.1% |
| Immigrants | Egypt | 99.4 /100 | #58 | Exceptional 1.1% |
| Immigrants | Malaysia | 99.4 /100 | #59 | Exceptional 1.1% |
| Immigrants | Western Asia | 99.2 /100 | #60 | Exceptional 1.1% |
| Immigrants | Ethiopia | 99.2 /100 | #61 | Exceptional 1.1% |
| Immigrants | Switzerland | 99.2 /100 | #62 | Exceptional 1.1% |
| Immigrants | Vietnam | 99.1 /100 | #63 | Exceptional 1.1% |
| Egyptians | 98.9 /100 | #64 | Exceptional 1.1% |
Demographics Similar to Indonesians by Disability Age Under 5
In terms of disability age under 5, the demographic groups most similar to Indonesians are Immigrants from Morocco (1.2%, a difference of 0.070%), Immigrants from Nicaragua (1.2%, a difference of 0.070%), Immigrants from Uganda (1.1%, a difference of 0.12%), Immigrants from South Africa (1.2%, a difference of 0.19%), and Nicaraguan (1.1%, a difference of 0.24%).
| Demographics | Rating | Rank | Disability Age Under 5 |
| Immigrants | Iraq | 96.5 /100 | #97 | Exceptional 1.1% |
| Immigrants | South Eastern Asia | 96.5 /100 | #98 | Exceptional 1.1% |
| Dominicans | 96.3 /100 | #99 | Exceptional 1.1% |
| Nicaraguans | 96.3 /100 | #100 | Exceptional 1.1% |
| Immigrants | Uganda | 96.1 /100 | #101 | Exceptional 1.1% |
| Immigrants | Morocco | 96.0 /100 | #102 | Exceptional 1.2% |
| Immigrants | Nicaragua | 96.0 /100 | #103 | Exceptional 1.2% |
| Indonesians | 95.9 /100 | #104 | Exceptional 1.2% |
| Immigrants | South Africa | 95.6 /100 | #105 | Exceptional 1.2% |
| Cambodians | 95.4 /100 | #106 | Exceptional 1.2% |
| Immigrants | West Indies | 95.3 /100 | #107 | Exceptional 1.2% |
| Iraqis | 95.1 /100 | #108 | Exceptional 1.2% |
| Immigrants | Panama | 95.0 /100 | #109 | Exceptional 1.2% |
| Immigrants | Lebanon | 95.0 /100 | #110 | Exceptional 1.2% |
| Senegalese | 94.6 /100 | #111 | Exceptional 1.2% |