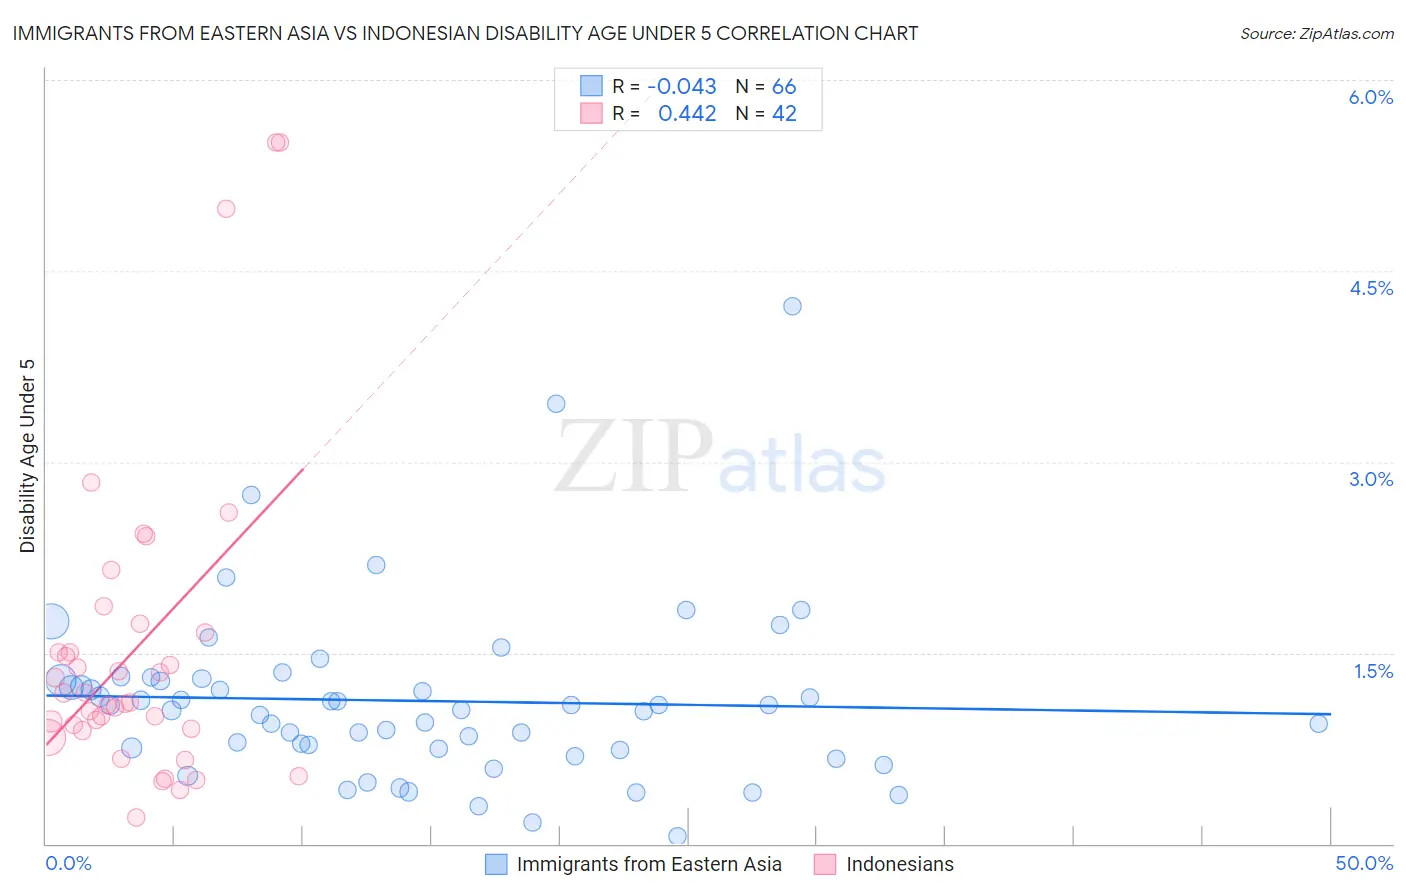
Immigrants from Eastern Asia vs Indonesian Disability Age Under 5
COMPARE
Immigrants from Eastern Asia
Indonesian
Disability Age Under 5
Disability Age Under 5 Comparison
Immigrants from Eastern Asia
Indonesians
1.0%
DISABILITY AGE UNDER 5
100.0/ 100
METRIC RATING
28th/ 347
METRIC RANK
1.2%
DISABILITY AGE UNDER 5
95.9/ 100
METRIC RATING
104th/ 347
METRIC RANK
Immigrants from Eastern Asia vs Indonesian Disability Age Under 5 Correlation Chart
The statistical analysis conducted on geographies consisting of 247,629,306 people shows no correlation between the proportion of Immigrants from Eastern Asia and percentage of population with a disability under the age of 5 in the United States with a correlation coefficient (R) of -0.043 and weighted average of 1.0%. Similarly, the statistical analysis conducted on geographies consisting of 116,670,957 people shows a moderate positive correlation between the proportion of Indonesians and percentage of population with a disability under the age of 5 in the United States with a correlation coefficient (R) of 0.442 and weighted average of 1.2%, a difference of 12.8%.
Disability Age Under 5 Correlation Summary
| Measurement | Immigrants from Eastern Asia | Indonesian |
| Minimum | 0.058% | 0.21% |
| Maximum | 4.2% | 5.5% |
| Range | 4.2% | 5.3% |
| Mean | 1.1% | 1.5% |
| Median | 1.1% | 1.1% |
| Interquartile 25% (IQ1) | 0.74% | 0.90% |
| Interquartile 75% (IQ3) | 1.3% | 1.7% |
| Interquartile Range (IQR) | 0.54% | 0.76% |
| Standard Deviation (Sample) | 0.69% | 1.2% |
| Standard Deviation (Population) | 0.69% | 1.2% |
Similar Demographics by Disability Age Under 5
Demographics Similar to Immigrants from Eastern Asia by Disability Age Under 5
In terms of disability age under 5, the demographic groups most similar to Immigrants from Eastern Asia are Immigrants from Belarus (1.0%, a difference of 0.12%), Guyanese (1.0%, a difference of 0.63%), Immigrants from South Central Asia (1.0%, a difference of 0.65%), Armenian (1.0%, a difference of 0.93%), and Iranian (1.0%, a difference of 0.98%).
| Demographics | Rating | Rank | Disability Age Under 5 |
| British West Indians | 100.0 /100 | #21 | Exceptional 0.99% |
| Immigrants | Iran | 100.0 /100 | #22 | Exceptional 1.00% |
| Yakama | 100.0 /100 | #23 | Exceptional 1.00% |
| Indians (Asian) | 100.0 /100 | #24 | Exceptional 1.0% |
| Immigrants | Micronesia | 100.0 /100 | #25 | Exceptional 1.0% |
| Immigrants | Taiwan | 100.0 /100 | #26 | Exceptional 1.0% |
| Guyanese | 100.0 /100 | #27 | Exceptional 1.0% |
| Immigrants | Eastern Asia | 100.0 /100 | #28 | Exceptional 1.0% |
| Immigrants | Belarus | 100.0 /100 | #29 | Exceptional 1.0% |
| Immigrants | South Central Asia | 99.9 /100 | #30 | Exceptional 1.0% |
| Armenians | 99.9 /100 | #31 | Exceptional 1.0% |
| Iranians | 99.9 /100 | #32 | Exceptional 1.0% |
| Bolivians | 99.9 /100 | #33 | Exceptional 1.0% |
| Immigrants | Ukraine | 99.9 /100 | #34 | Exceptional 1.0% |
| Barbadians | 99.9 /100 | #35 | Exceptional 1.0% |
Demographics Similar to Indonesians by Disability Age Under 5
In terms of disability age under 5, the demographic groups most similar to Indonesians are Immigrants from Morocco (1.2%, a difference of 0.070%), Immigrants from Nicaragua (1.2%, a difference of 0.070%), Immigrants from Uganda (1.1%, a difference of 0.12%), Immigrants from South Africa (1.2%, a difference of 0.19%), and Nicaraguan (1.1%, a difference of 0.24%).
| Demographics | Rating | Rank | Disability Age Under 5 |
| Immigrants | Iraq | 96.5 /100 | #97 | Exceptional 1.1% |
| Immigrants | South Eastern Asia | 96.5 /100 | #98 | Exceptional 1.1% |
| Dominicans | 96.3 /100 | #99 | Exceptional 1.1% |
| Nicaraguans | 96.3 /100 | #100 | Exceptional 1.1% |
| Immigrants | Uganda | 96.1 /100 | #101 | Exceptional 1.1% |
| Immigrants | Morocco | 96.0 /100 | #102 | Exceptional 1.2% |
| Immigrants | Nicaragua | 96.0 /100 | #103 | Exceptional 1.2% |
| Indonesians | 95.9 /100 | #104 | Exceptional 1.2% |
| Immigrants | South Africa | 95.6 /100 | #105 | Exceptional 1.2% |
| Cambodians | 95.4 /100 | #106 | Exceptional 1.2% |
| Immigrants | West Indies | 95.3 /100 | #107 | Exceptional 1.2% |
| Iraqis | 95.1 /100 | #108 | Exceptional 1.2% |
| Immigrants | Panama | 95.0 /100 | #109 | Exceptional 1.2% |
| Immigrants | Lebanon | 95.0 /100 | #110 | Exceptional 1.2% |
| Senegalese | 94.6 /100 | #111 | Exceptional 1.2% |