Lithuanian vs Immigrants from Cameroon In Labor Force | Age 45-54
COMPARE
Lithuanian
Immigrants from Cameroon
In Labor Force | Age 45-54
In Labor Force | Age 45-54 Comparison
Lithuanians
Immigrants from Cameroon
83.6%
IN LABOR FORCE | AGE 45-54
99.1/ 100
METRIC RATING
46th/ 347
METRIC RANK
84.6%
IN LABOR FORCE | AGE 45-54
100.0/ 100
METRIC RATING
7th/ 347
METRIC RANK
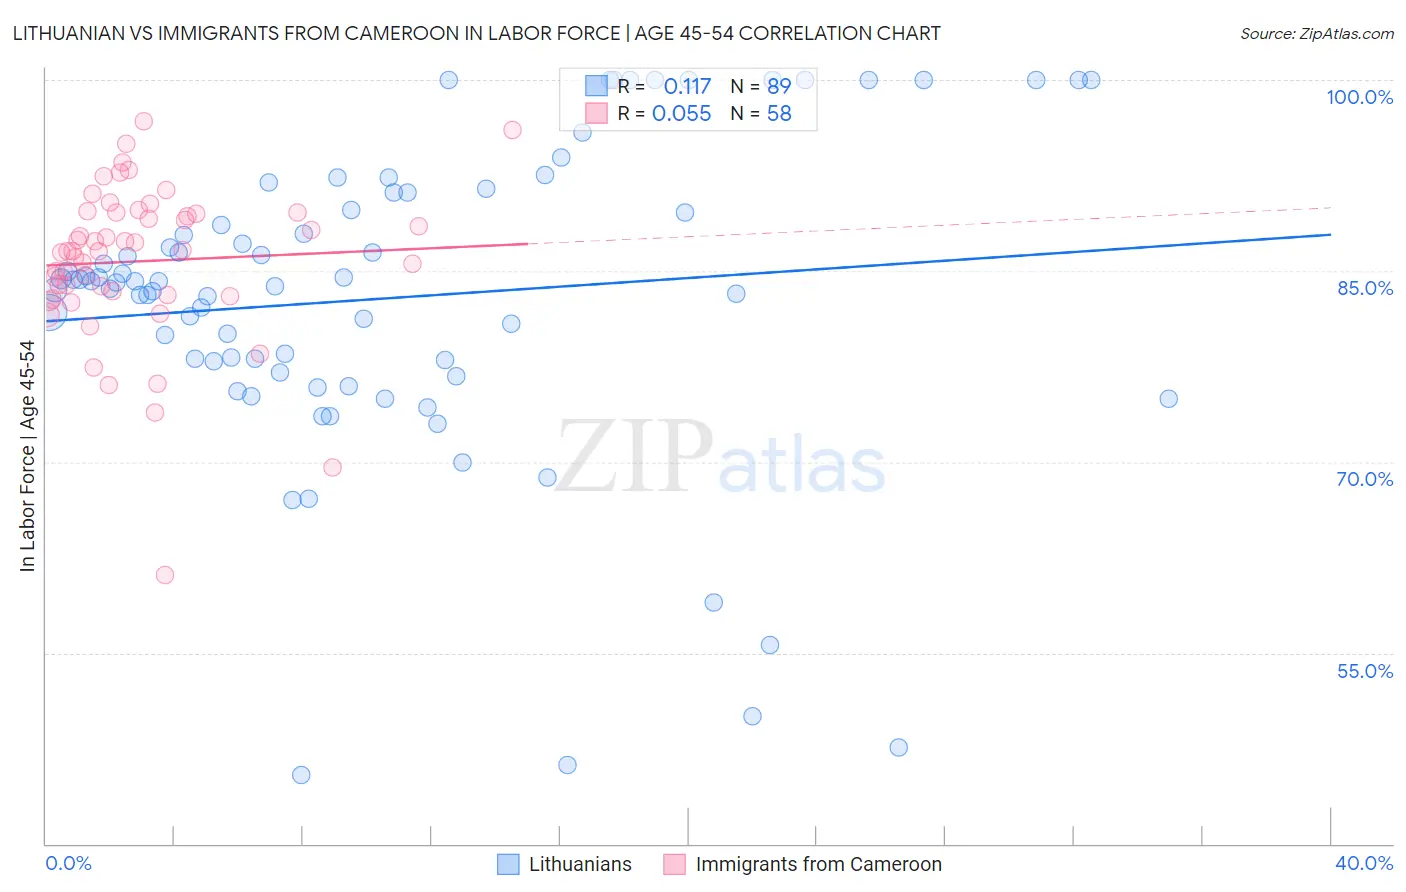
Lithuanian vs Immigrants from Cameroon In Labor Force | Age 45-54 Correlation Chart
The statistical analysis conducted on geographies consisting of 421,730,198 people shows a poor positive correlation between the proportion of Lithuanians and labor force participation rate among population between the ages 45 and 54 in the United States with a correlation coefficient (R) of 0.117 and weighted average of 83.6%. Similarly, the statistical analysis conducted on geographies consisting of 130,722,370 people shows a slight positive correlation between the proportion of Immigrants from Cameroon and labor force participation rate among population between the ages 45 and 54 in the United States with a correlation coefficient (R) of 0.055 and weighted average of 84.6%, a difference of 1.2%.
In Labor Force | Age 45-54 Correlation Summary
| Measurement | Lithuanian | Immigrants from Cameroon |
| Minimum | 45.4% | 61.1% |
| Maximum | 100.0% | 96.8% |
| Range | 54.6% | 35.7% |
| Mean | 82.9% | 85.8% |
| Median | 84.2% | 86.5% |
| Interquartile 25% (IQ1) | 77.5% | 83.1% |
| Interquartile 75% (IQ3) | 90.5% | 89.6% |
| Interquartile Range (IQR) | 13.0% | 6.5% |
| Standard Deviation (Sample) | 12.2% | 6.2% |
| Standard Deviation (Population) | 12.2% | 6.2% |
Similar Demographics by In Labor Force | Age 45-54
Demographics Similar to Lithuanians by In Labor Force | Age 45-54
In terms of in labor force | age 45-54, the demographic groups most similar to Lithuanians are Burmese (83.6%, a difference of 0.010%), Immigrants from Hong Kong (83.6%, a difference of 0.010%), Croatian (83.6%, a difference of 0.010%), Immigrants from Poland (83.6%, a difference of 0.020%), and Immigrants from Morocco (83.6%, a difference of 0.020%).
| Demographics | Rating | Rank | In Labor Force | Age 45-54 |
| Immigrants | Cuba | 99.4 /100 | #39 | Exceptional 83.7% |
| Immigrants | Uganda | 99.4 /100 | #40 | Exceptional 83.7% |
| Immigrants | Korea | 99.3 /100 | #41 | Exceptional 83.7% |
| Immigrants | Moldova | 99.3 /100 | #42 | Exceptional 83.7% |
| Venezuelans | 99.2 /100 | #43 | Exceptional 83.6% |
| Burmese | 99.1 /100 | #44 | Exceptional 83.6% |
| Immigrants | Hong Kong | 99.1 /100 | #45 | Exceptional 83.6% |
| Lithuanians | 99.1 /100 | #46 | Exceptional 83.6% |
| Croatians | 99.0 /100 | #47 | Exceptional 83.6% |
| Immigrants | Poland | 99.0 /100 | #48 | Exceptional 83.6% |
| Immigrants | Morocco | 99.0 /100 | #49 | Exceptional 83.6% |
| Immigrants | Greece | 98.8 /100 | #50 | Exceptional 83.6% |
| Immigrants | Turkey | 98.8 /100 | #51 | Exceptional 83.6% |
| Poles | 98.7 /100 | #52 | Exceptional 83.6% |
| Peruvians | 98.7 /100 | #53 | Exceptional 83.6% |
Demographics Similar to Immigrants from Cameroon by In Labor Force | Age 45-54
In terms of in labor force | age 45-54, the demographic groups most similar to Immigrants from Cameroon are Immigrants from India (84.7%, a difference of 0.070%), Sierra Leonean (84.5%, a difference of 0.11%), Ethiopian (84.8%, a difference of 0.18%), Immigrants from Sierra Leone (84.4%, a difference of 0.22%), and Norwegian (84.4%, a difference of 0.24%).
| Demographics | Rating | Rank | In Labor Force | Age 45-54 |
| Immigrants | Bolivia | 100.0 /100 | #1 | Exceptional 85.3% |
| Luxembourgers | 100.0 /100 | #2 | Exceptional 85.0% |
| Bolivians | 100.0 /100 | #3 | Exceptional 84.9% |
| Immigrants | Ethiopia | 100.0 /100 | #4 | Exceptional 84.8% |
| Ethiopians | 100.0 /100 | #5 | Exceptional 84.8% |
| Immigrants | India | 100.0 /100 | #6 | Exceptional 84.7% |
| Immigrants | Cameroon | 100.0 /100 | #7 | Exceptional 84.6% |
| Sierra Leoneans | 100.0 /100 | #8 | Exceptional 84.5% |
| Immigrants | Sierra Leone | 100.0 /100 | #9 | Exceptional 84.4% |
| Norwegians | 100.0 /100 | #10 | Exceptional 84.4% |
| Thais | 100.0 /100 | #11 | Exceptional 84.3% |
| Bulgarians | 100.0 /100 | #12 | Exceptional 84.2% |
| Chinese | 99.9 /100 | #13 | Exceptional 84.1% |
| Cambodians | 99.9 /100 | #14 | Exceptional 84.1% |
| Cypriots | 99.9 /100 | #15 | Exceptional 84.1% |