Immigrants from Caribbean vs Immigrants from Australia Disability Age 5 to 17
COMPARE
Immigrants from Caribbean
Immigrants from Australia
Disability Age 5 to 17
Disability Age 5 to 17 Comparison
Immigrants from Caribbean
Immigrants from Australia
5.9%
DISABILITY AGE 5 TO 17
2.1/ 100
METRIC RATING
241st/ 347
METRIC RANK
5.0%
DISABILITY AGE 5 TO 17
100.0/ 100
METRIC RATING
41st/ 347
METRIC RANK
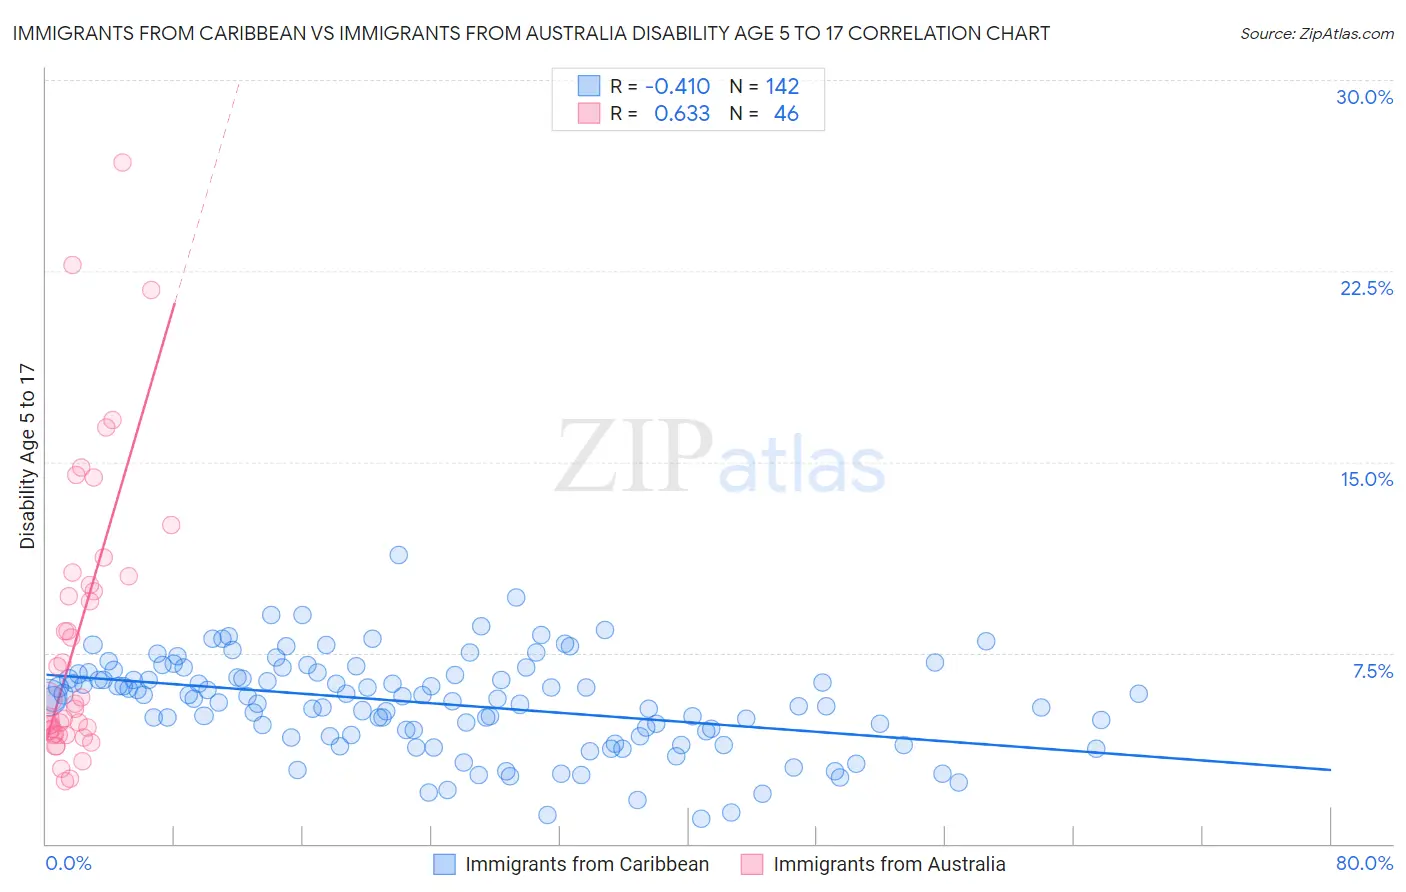
Immigrants from Caribbean vs Immigrants from Australia Disability Age 5 to 17 Correlation Chart
The statistical analysis conducted on geographies consisting of 445,217,348 people shows a moderate negative correlation between the proportion of Immigrants from Caribbean and percentage of population with a disability between the ages 5 and 17 in the United States with a correlation coefficient (R) of -0.410 and weighted average of 5.9%. Similarly, the statistical analysis conducted on geographies consisting of 226,040,529 people shows a significant positive correlation between the proportion of Immigrants from Australia and percentage of population with a disability between the ages 5 and 17 in the United States with a correlation coefficient (R) of 0.633 and weighted average of 5.0%, a difference of 16.9%.
Disability Age 5 to 17 Correlation Summary
| Measurement | Immigrants from Caribbean | Immigrants from Australia |
| Minimum | 1.0% | 2.5% |
| Maximum | 11.3% | 26.8% |
| Range | 10.3% | 24.3% |
| Mean | 5.5% | 8.3% |
| Median | 5.7% | 5.6% |
| Interquartile 25% (IQ1) | 4.3% | 4.3% |
| Interquartile 75% (IQ3) | 6.7% | 10.5% |
| Interquartile Range (IQR) | 2.4% | 6.2% |
| Standard Deviation (Sample) | 1.9% | 5.7% |
| Standard Deviation (Population) | 1.8% | 5.6% |
Similar Demographics by Disability Age 5 to 17
Demographics Similar to Immigrants from Caribbean by Disability Age 5 to 17
In terms of disability age 5 to 17, the demographic groups most similar to Immigrants from Caribbean are Spaniard (5.9%, a difference of 0.080%), Indonesian (5.9%, a difference of 0.090%), West Indian (5.9%, a difference of 0.13%), German Russian (5.9%, a difference of 0.15%), and Immigrants from Germany (5.9%, a difference of 0.15%).
| Demographics | Rating | Rank | Disability Age 5 to 17 |
| Immigrants | Kenya | 3.4 /100 | #234 | Tragic 5.8% |
| Malaysians | 3.4 /100 | #235 | Tragic 5.8% |
| Immigrants | Brazil | 3.2 /100 | #236 | Tragic 5.8% |
| Sudanese | 2.9 /100 | #237 | Tragic 5.8% |
| Hungarians | 2.6 /100 | #238 | Tragic 5.8% |
| German Russians | 2.4 /100 | #239 | Tragic 5.9% |
| West Indians | 2.4 /100 | #240 | Tragic 5.9% |
| Immigrants | Caribbean | 2.1 /100 | #241 | Tragic 5.9% |
| Spaniards | 2.0 /100 | #242 | Tragic 5.9% |
| Indonesians | 2.0 /100 | #243 | Tragic 5.9% |
| Immigrants | Germany | 1.9 /100 | #244 | Tragic 5.9% |
| Immigrants | Micronesia | 1.9 /100 | #245 | Tragic 5.9% |
| Tlingit-Haida | 1.9 /100 | #246 | Tragic 5.9% |
| Immigrants | Honduras | 1.8 /100 | #247 | Tragic 5.9% |
| British | 1.7 /100 | #248 | Tragic 5.9% |
Demographics Similar to Immigrants from Australia by Disability Age 5 to 17
In terms of disability age 5 to 17, the demographic groups most similar to Immigrants from Australia are Immigrants from Sri Lanka (5.0%, a difference of 0.010%), Okinawan (5.0%, a difference of 0.080%), Immigrants from Philippines (5.0%, a difference of 0.16%), Immigrants from Argentina (5.0%, a difference of 0.16%), and Immigrants from Belarus (5.0%, a difference of 0.20%).
| Demographics | Rating | Rank | Disability Age 5 to 17 |
| Israelis | 100.0 /100 | #34 | Exceptional 5.0% |
| Bolivians | 100.0 /100 | #35 | Exceptional 5.0% |
| Immigrants | Egypt | 100.0 /100 | #36 | Exceptional 5.0% |
| Immigrants | Belarus | 100.0 /100 | #37 | Exceptional 5.0% |
| Immigrants | Philippines | 100.0 /100 | #38 | Exceptional 5.0% |
| Immigrants | Argentina | 100.0 /100 | #39 | Exceptional 5.0% |
| Okinawans | 100.0 /100 | #40 | Exceptional 5.0% |
| Immigrants | Australia | 100.0 /100 | #41 | Exceptional 5.0% |
| Immigrants | Sri Lanka | 100.0 /100 | #42 | Exceptional 5.0% |
| Immigrants | Russia | 100.0 /100 | #43 | Exceptional 5.0% |
| Egyptians | 100.0 /100 | #44 | Exceptional 5.0% |
| Tongans | 100.0 /100 | #45 | Exceptional 5.0% |
| Assyrians/Chaldeans/Syriacs | 100.0 /100 | #46 | Exceptional 5.0% |
| Vietnamese | 100.0 /100 | #47 | Exceptional 5.1% |
| Koreans | 100.0 /100 | #48 | Exceptional 5.1% |