Liberian vs Immigrants from Burma/Myanmar Ambulatory Disability
COMPARE
Liberian
Immigrants from Burma/Myanmar
Ambulatory Disability
Ambulatory Disability Comparison
Liberians
Immigrants from Burma/Myanmar
6.3%
AMBULATORY DISABILITY
7.1/ 100
METRIC RATING
224th/ 347
METRIC RANK
6.1%
AMBULATORY DISABILITY
52.2/ 100
METRIC RATING
172nd/ 347
METRIC RANK
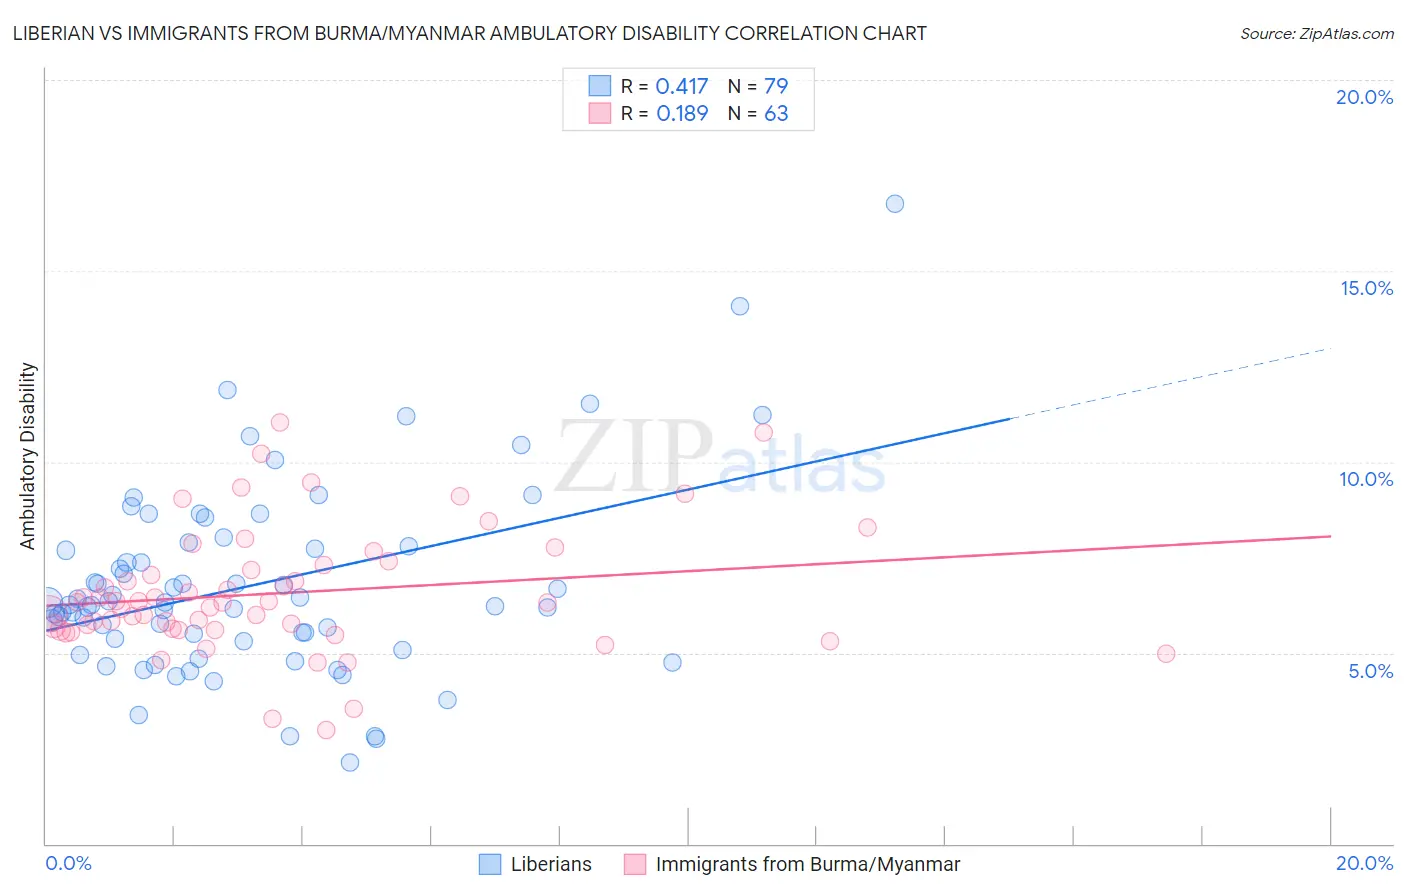
Liberian vs Immigrants from Burma/Myanmar Ambulatory Disability Correlation Chart
The statistical analysis conducted on geographies consisting of 118,077,126 people shows a moderate positive correlation between the proportion of Liberians and percentage of population with ambulatory disability in the United States with a correlation coefficient (R) of 0.417 and weighted average of 6.3%. Similarly, the statistical analysis conducted on geographies consisting of 172,292,594 people shows a poor positive correlation between the proportion of Immigrants from Burma/Myanmar and percentage of population with ambulatory disability in the United States with a correlation coefficient (R) of 0.189 and weighted average of 6.1%, a difference of 3.5%.
Ambulatory Disability Correlation Summary
| Measurement | Liberian | Immigrants from Burma/Myanmar |
| Minimum | 2.1% | 3.0% |
| Maximum | 16.8% | 11.0% |
| Range | 14.6% | 8.0% |
| Mean | 6.8% | 6.6% |
| Median | 6.3% | 6.3% |
| Interquartile 25% (IQ1) | 5.3% | 5.6% |
| Interquartile 75% (IQ3) | 7.8% | 7.3% |
| Interquartile Range (IQR) | 2.5% | 1.7% |
| Standard Deviation (Sample) | 2.5% | 1.6% |
| Standard Deviation (Population) | 2.5% | 1.6% |
Similar Demographics by Ambulatory Disability
Demographics Similar to Liberians by Ambulatory Disability
In terms of ambulatory disability, the demographic groups most similar to Liberians are Immigrants from Honduras (6.3%, a difference of 0.10%), Honduran (6.3%, a difference of 0.17%), German Russian (6.3%, a difference of 0.39%), Immigrants from Albania (6.3%, a difference of 0.42%), and Hungarian (6.3%, a difference of 0.42%).
| Demographics | Rating | Rank | Ambulatory Disability |
| Yugoslavians | 10.9 /100 | #217 | Poor 6.3% |
| Guamanians/Chamorros | 10.6 /100 | #218 | Poor 6.3% |
| Indonesians | 9.9 /100 | #219 | Tragic 6.3% |
| Immigrants | Albania | 9.6 /100 | #220 | Tragic 6.3% |
| Hungarians | 9.6 /100 | #221 | Tragic 6.3% |
| German Russians | 9.4 /100 | #222 | Tragic 6.3% |
| Immigrants | Honduras | 7.6 /100 | #223 | Tragic 6.3% |
| Liberians | 7.1 /100 | #224 | Tragic 6.3% |
| Hondurans | 6.3 /100 | #225 | Tragic 6.3% |
| Slavs | 5.1 /100 | #226 | Tragic 6.4% |
| Cubans | 4.0 /100 | #227 | Tragic 6.4% |
| Portuguese | 4.0 /100 | #228 | Tragic 6.4% |
| Czechoslovakians | 3.8 /100 | #229 | Tragic 6.4% |
| Mexicans | 3.5 /100 | #230 | Tragic 6.4% |
| Panamanians | 3.1 /100 | #231 | Tragic 6.4% |
Demographics Similar to Immigrants from Burma/Myanmar by Ambulatory Disability
In terms of ambulatory disability, the demographic groups most similar to Immigrants from Burma/Myanmar are Moroccan (6.1%, a difference of 0.020%), Croatian (6.1%, a difference of 0.050%), Immigrants from Ecuador (6.1%, a difference of 0.090%), Immigrants from Canada (6.1%, a difference of 0.11%), and Vietnamese (6.1%, a difference of 0.26%).
| Demographics | Rating | Rank | Ambulatory Disability |
| Nicaraguans | 63.2 /100 | #165 | Good 6.1% |
| Iraqis | 62.8 /100 | #166 | Good 6.1% |
| Immigrants | Oceania | 60.7 /100 | #167 | Good 6.1% |
| Ecuadorians | 60.5 /100 | #168 | Good 6.1% |
| Immigrants | Southern Europe | 58.1 /100 | #169 | Average 6.1% |
| Immigrants | Ecuador | 53.8 /100 | #170 | Average 6.1% |
| Moroccans | 52.6 /100 | #171 | Average 6.1% |
| Immigrants | Burma/Myanmar | 52.2 /100 | #172 | Average 6.1% |
| Croatians | 51.2 /100 | #173 | Average 6.1% |
| Immigrants | Canada | 50.0 /100 | #174 | Average 6.1% |
| Vietnamese | 47.2 /100 | #175 | Average 6.1% |
| Immigrants | North America | 45.6 /100 | #176 | Average 6.1% |
| Immigrants | England | 45.4 /100 | #177 | Average 6.1% |
| Scandinavians | 44.5 /100 | #178 | Average 6.1% |
| Austrians | 44.1 /100 | #179 | Average 6.1% |