Guatemalan vs Immigrants from Burma/Myanmar Ambulatory Disability
COMPARE
Guatemalan
Immigrants from Burma/Myanmar
Ambulatory Disability
Ambulatory Disability Comparison
Guatemalans
Immigrants from Burma/Myanmar
6.2%
AMBULATORY DISABILITY
30.0/ 100
METRIC RATING
193rd/ 347
METRIC RANK
6.1%
AMBULATORY DISABILITY
52.2/ 100
METRIC RATING
172nd/ 347
METRIC RANK
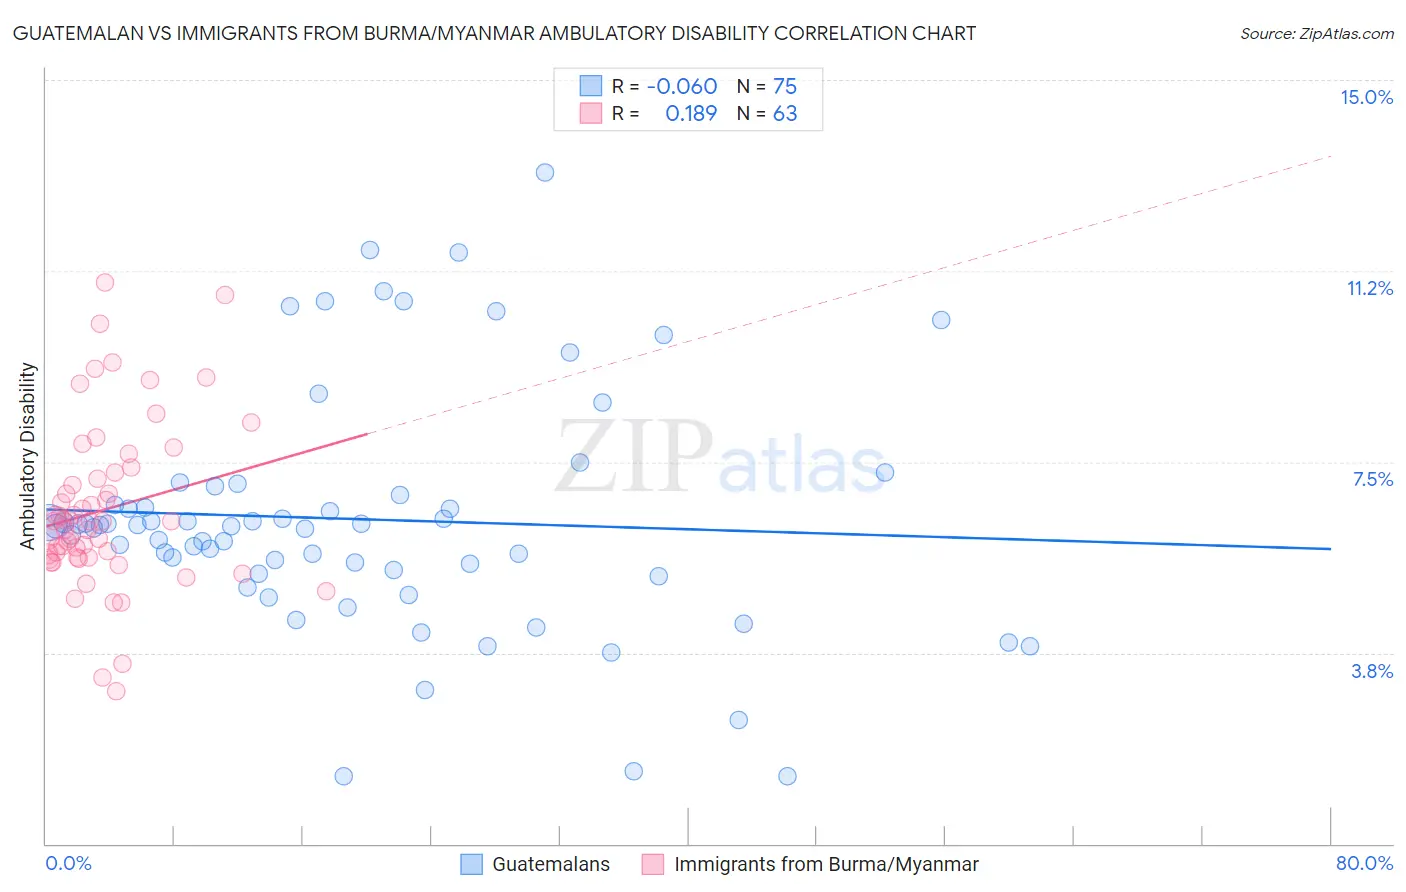
Guatemalan vs Immigrants from Burma/Myanmar Ambulatory Disability Correlation Chart
The statistical analysis conducted on geographies consisting of 409,382,771 people shows a slight negative correlation between the proportion of Guatemalans and percentage of population with ambulatory disability in the United States with a correlation coefficient (R) of -0.060 and weighted average of 6.2%. Similarly, the statistical analysis conducted on geographies consisting of 172,292,594 people shows a poor positive correlation between the proportion of Immigrants from Burma/Myanmar and percentage of population with ambulatory disability in the United States with a correlation coefficient (R) of 0.189 and weighted average of 6.1%, a difference of 1.2%.
Ambulatory Disability Correlation Summary
| Measurement | Guatemalan | Immigrants from Burma/Myanmar |
| Minimum | 1.3% | 3.0% |
| Maximum | 13.2% | 11.0% |
| Range | 11.9% | 8.0% |
| Mean | 6.4% | 6.6% |
| Median | 6.2% | 6.3% |
| Interquartile 25% (IQ1) | 5.3% | 5.6% |
| Interquartile 75% (IQ3) | 6.8% | 7.3% |
| Interquartile Range (IQR) | 1.5% | 1.7% |
| Standard Deviation (Sample) | 2.4% | 1.6% |
| Standard Deviation (Population) | 2.3% | 1.6% |
Similar Demographics by Ambulatory Disability
Demographics Similar to Guatemalans by Ambulatory Disability
In terms of ambulatory disability, the demographic groups most similar to Guatemalans are Alaska Native (6.2%, a difference of 0.010%), Belgian (6.2%, a difference of 0.080%), Immigrants from Western Europe (6.2%, a difference of 0.10%), Malaysian (6.2%, a difference of 0.11%), and Immigrants from Guatemala (6.2%, a difference of 0.12%).
| Demographics | Rating | Rank | Ambulatory Disability |
| Europeans | 36.2 /100 | #186 | Fair 6.2% |
| Carpatho Rusyns | 35.3 /100 | #187 | Fair 6.2% |
| British | 34.3 /100 | #188 | Fair 6.2% |
| Ukrainians | 34.0 /100 | #189 | Fair 6.2% |
| Immigrants | Western Africa | 33.4 /100 | #190 | Fair 6.2% |
| Immigrants | Guatemala | 31.9 /100 | #191 | Fair 6.2% |
| Immigrants | Western Europe | 31.6 /100 | #192 | Fair 6.2% |
| Guatemalans | 30.0 /100 | #193 | Fair 6.2% |
| Alaska Natives | 29.8 /100 | #194 | Fair 6.2% |
| Belgians | 28.6 /100 | #195 | Fair 6.2% |
| Malaysians | 28.2 /100 | #196 | Fair 6.2% |
| Poles | 26.3 /100 | #197 | Fair 6.2% |
| Immigrants | Bangladesh | 24.6 /100 | #198 | Fair 6.2% |
| Italians | 22.6 /100 | #199 | Fair 6.2% |
| Immigrants | Cambodia | 21.5 /100 | #200 | Fair 6.2% |
Demographics Similar to Immigrants from Burma/Myanmar by Ambulatory Disability
In terms of ambulatory disability, the demographic groups most similar to Immigrants from Burma/Myanmar are Moroccan (6.1%, a difference of 0.020%), Croatian (6.1%, a difference of 0.050%), Immigrants from Ecuador (6.1%, a difference of 0.090%), Immigrants from Canada (6.1%, a difference of 0.11%), and Vietnamese (6.1%, a difference of 0.26%).
| Demographics | Rating | Rank | Ambulatory Disability |
| Nicaraguans | 63.2 /100 | #165 | Good 6.1% |
| Iraqis | 62.8 /100 | #166 | Good 6.1% |
| Immigrants | Oceania | 60.7 /100 | #167 | Good 6.1% |
| Ecuadorians | 60.5 /100 | #168 | Good 6.1% |
| Immigrants | Southern Europe | 58.1 /100 | #169 | Average 6.1% |
| Immigrants | Ecuador | 53.8 /100 | #170 | Average 6.1% |
| Moroccans | 52.6 /100 | #171 | Average 6.1% |
| Immigrants | Burma/Myanmar | 52.2 /100 | #172 | Average 6.1% |
| Croatians | 51.2 /100 | #173 | Average 6.1% |
| Immigrants | Canada | 50.0 /100 | #174 | Average 6.1% |
| Vietnamese | 47.2 /100 | #175 | Average 6.1% |
| Immigrants | North America | 45.6 /100 | #176 | Average 6.1% |
| Immigrants | England | 45.4 /100 | #177 | Average 6.1% |
| Scandinavians | 44.5 /100 | #178 | Average 6.1% |
| Austrians | 44.1 /100 | #179 | Average 6.1% |