Liberian vs Immigrants from Eastern Africa Ambulatory Disability
COMPARE
Liberian
Immigrants from Eastern Africa
Ambulatory Disability
Ambulatory Disability Comparison
Liberians
Immigrants from Eastern Africa
6.3%
AMBULATORY DISABILITY
7.1/ 100
METRIC RATING
224th/ 347
METRIC RANK
5.6%
AMBULATORY DISABILITY
99.8/ 100
METRIC RATING
54th/ 347
METRIC RANK
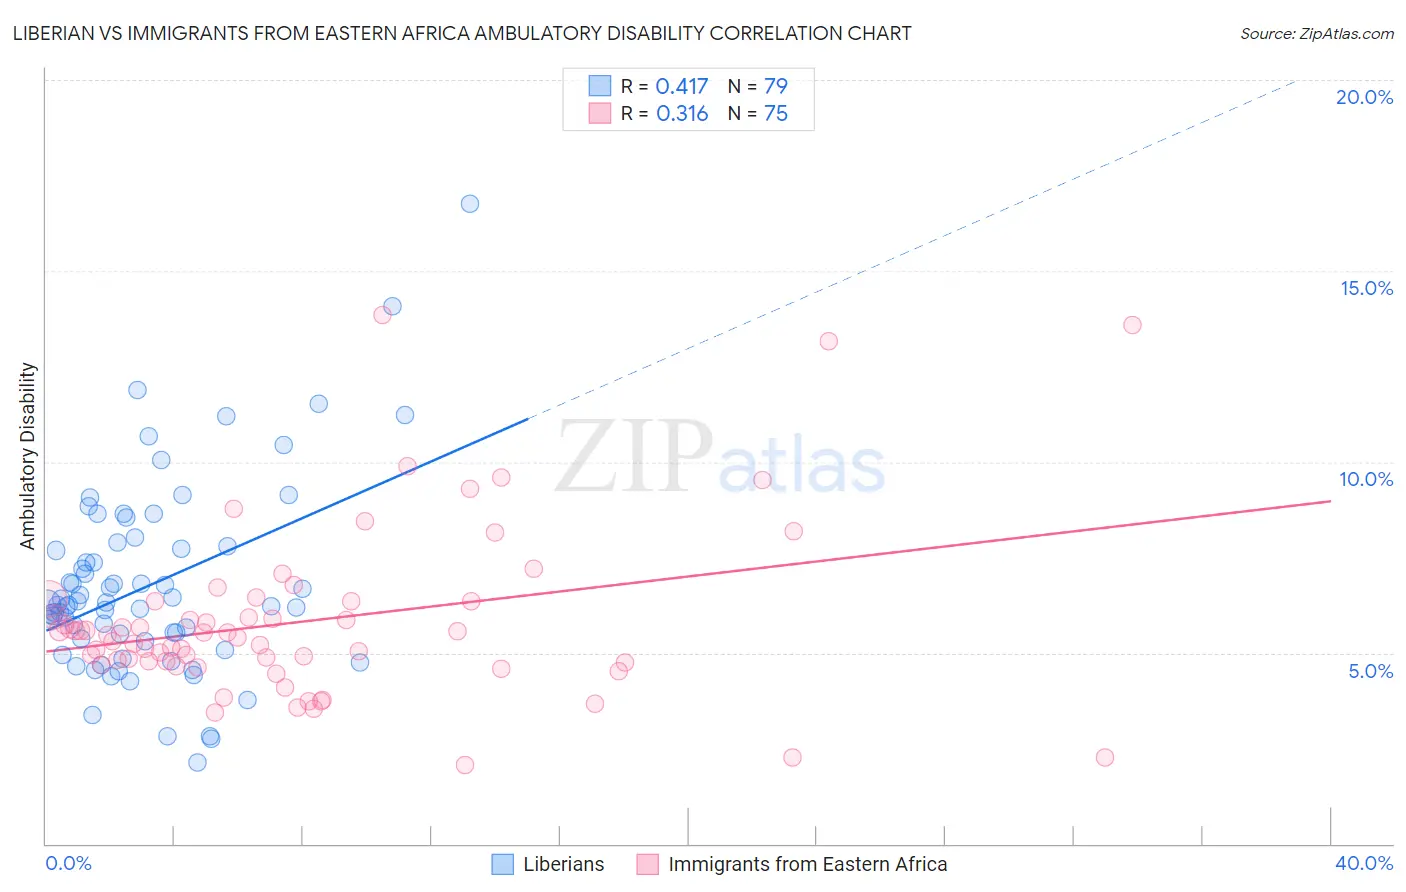
Liberian vs Immigrants from Eastern Africa Ambulatory Disability Correlation Chart
The statistical analysis conducted on geographies consisting of 118,077,126 people shows a moderate positive correlation between the proportion of Liberians and percentage of population with ambulatory disability in the United States with a correlation coefficient (R) of 0.417 and weighted average of 6.3%. Similarly, the statistical analysis conducted on geographies consisting of 355,025,576 people shows a mild positive correlation between the proportion of Immigrants from Eastern Africa and percentage of population with ambulatory disability in the United States with a correlation coefficient (R) of 0.316 and weighted average of 5.6%, a difference of 12.9%.
Ambulatory Disability Correlation Summary
| Measurement | Liberian | Immigrants from Eastern Africa |
| Minimum | 2.1% | 2.1% |
| Maximum | 16.8% | 13.8% |
| Range | 14.6% | 11.8% |
| Mean | 6.8% | 5.8% |
| Median | 6.3% | 5.5% |
| Interquartile 25% (IQ1) | 5.3% | 4.7% |
| Interquartile 75% (IQ3) | 7.8% | 6.4% |
| Interquartile Range (IQR) | 2.5% | 1.6% |
| Standard Deviation (Sample) | 2.5% | 2.2% |
| Standard Deviation (Population) | 2.5% | 2.2% |
Similar Demographics by Ambulatory Disability
Demographics Similar to Liberians by Ambulatory Disability
In terms of ambulatory disability, the demographic groups most similar to Liberians are Immigrants from Honduras (6.3%, a difference of 0.10%), Honduran (6.3%, a difference of 0.17%), German Russian (6.3%, a difference of 0.39%), Immigrants from Albania (6.3%, a difference of 0.42%), and Hungarian (6.3%, a difference of 0.42%).
| Demographics | Rating | Rank | Ambulatory Disability |
| Yugoslavians | 10.9 /100 | #217 | Poor 6.3% |
| Guamanians/Chamorros | 10.6 /100 | #218 | Poor 6.3% |
| Indonesians | 9.9 /100 | #219 | Tragic 6.3% |
| Immigrants | Albania | 9.6 /100 | #220 | Tragic 6.3% |
| Hungarians | 9.6 /100 | #221 | Tragic 6.3% |
| German Russians | 9.4 /100 | #222 | Tragic 6.3% |
| Immigrants | Honduras | 7.6 /100 | #223 | Tragic 6.3% |
| Liberians | 7.1 /100 | #224 | Tragic 6.3% |
| Hondurans | 6.3 /100 | #225 | Tragic 6.3% |
| Slavs | 5.1 /100 | #226 | Tragic 6.4% |
| Cubans | 4.0 /100 | #227 | Tragic 6.4% |
| Portuguese | 4.0 /100 | #228 | Tragic 6.4% |
| Czechoslovakians | 3.8 /100 | #229 | Tragic 6.4% |
| Mexicans | 3.5 /100 | #230 | Tragic 6.4% |
| Panamanians | 3.1 /100 | #231 | Tragic 6.4% |
Demographics Similar to Immigrants from Eastern Africa by Ambulatory Disability
In terms of ambulatory disability, the demographic groups most similar to Immigrants from Eastern Africa are Immigrants from Egypt (5.6%, a difference of 0.050%), Jordanian (5.6%, a difference of 0.060%), Immigrants from Bulgaria (5.6%, a difference of 0.070%), Taiwanese (5.6%, a difference of 0.15%), and Inupiat (5.6%, a difference of 0.16%).
| Demographics | Rating | Rank | Ambulatory Disability |
| Immigrants | Japan | 99.9 /100 | #47 | Exceptional 5.6% |
| Immigrants | Argentina | 99.9 /100 | #48 | Exceptional 5.6% |
| Bulgarians | 99.9 /100 | #49 | Exceptional 5.6% |
| Luxembourgers | 99.9 /100 | #50 | Exceptional 5.6% |
| Taiwanese | 99.8 /100 | #51 | Exceptional 5.6% |
| Jordanians | 99.8 /100 | #52 | Exceptional 5.6% |
| Immigrants | Egypt | 99.8 /100 | #53 | Exceptional 5.6% |
| Immigrants | Eastern Africa | 99.8 /100 | #54 | Exceptional 5.6% |
| Immigrants | Bulgaria | 99.8 /100 | #55 | Exceptional 5.6% |
| Inupiat | 99.8 /100 | #56 | Exceptional 5.6% |
| Immigrants | Brazil | 99.8 /100 | #57 | Exceptional 5.6% |
| Immigrants | Zimbabwe | 99.8 /100 | #58 | Exceptional 5.6% |
| Immigrants | Afghanistan | 99.8 /100 | #59 | Exceptional 5.6% |
| Immigrants | Lithuania | 99.8 /100 | #60 | Exceptional 5.6% |
| Immigrants | Belgium | 99.7 /100 | #61 | Exceptional 5.6% |