Liberian vs Immigrants from Burma/Myanmar Per Capita Income
COMPARE
Liberian
Immigrants from Burma/Myanmar
Per Capita Income
Per Capita Income Comparison
Liberians
Immigrants from Burma/Myanmar
$38,780
PER CAPITA INCOME
0.4/ 100
METRIC RATING
268th/ 347
METRIC RANK
$39,827
PER CAPITA INCOME
1.3/ 100
METRIC RATING
250th/ 347
METRIC RANK
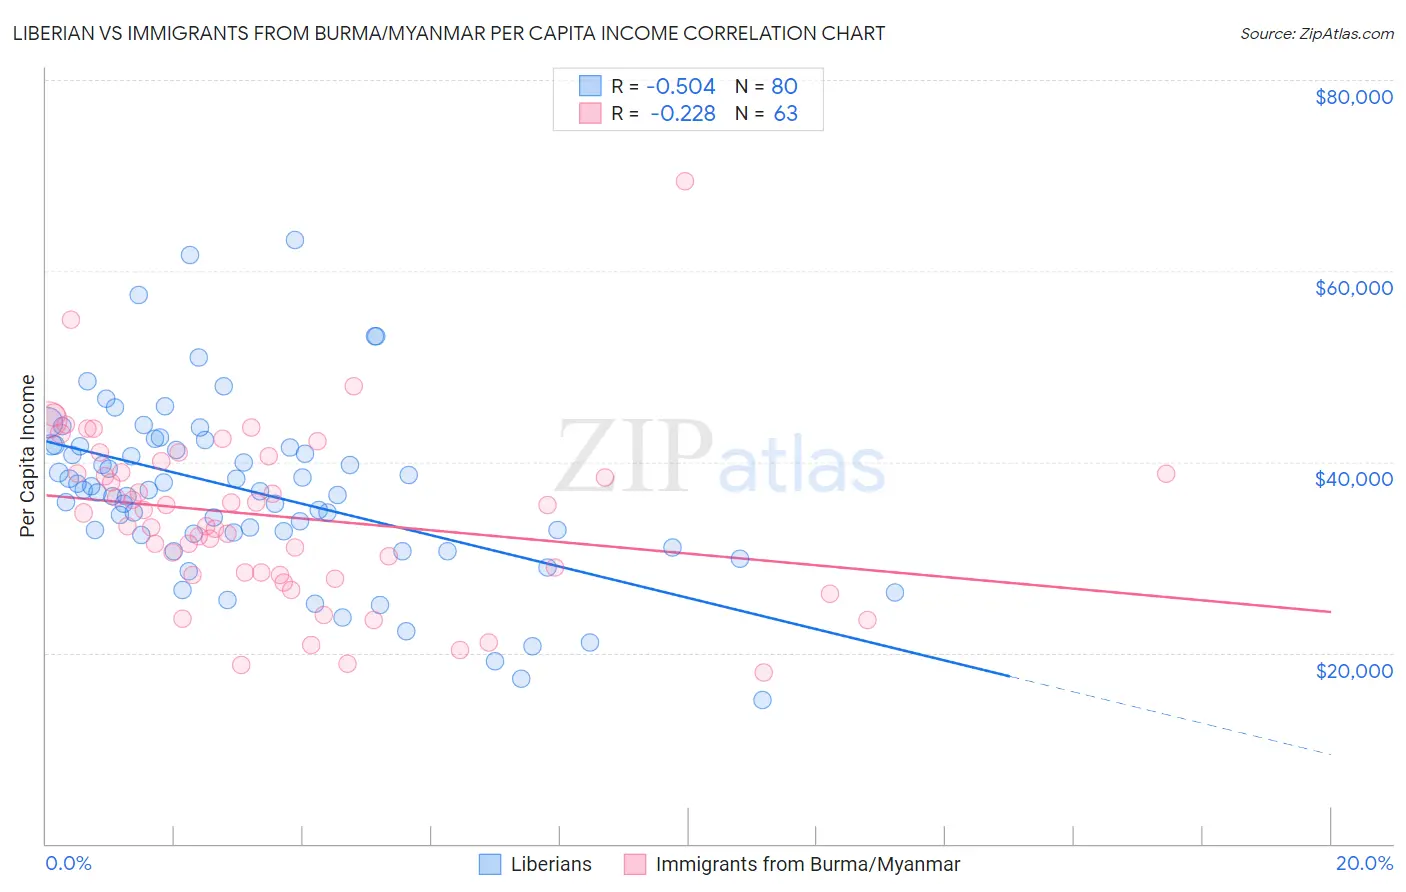
Liberian vs Immigrants from Burma/Myanmar Per Capita Income Correlation Chart
The statistical analysis conducted on geographies consisting of 118,107,140 people shows a substantial negative correlation between the proportion of Liberians and per capita income in the United States with a correlation coefficient (R) of -0.504 and weighted average of $38,780. Similarly, the statistical analysis conducted on geographies consisting of 172,363,704 people shows a weak negative correlation between the proportion of Immigrants from Burma/Myanmar and per capita income in the United States with a correlation coefficient (R) of -0.228 and weighted average of $39,827, a difference of 2.7%.
Per Capita Income Correlation Summary
| Measurement | Liberian | Immigrants from Burma/Myanmar |
| Minimum | $15,041 | $17,897 |
| Maximum | $63,224 | $69,358 |
| Range | $48,183 | $51,461 |
| Mean | $36,863 | $34,299 |
| Median | $37,001 | $34,636 |
| Interquartile 25% (IQ1) | $32,406 | $28,210 |
| Interquartile 75% (IQ3) | $41,709 | $40,057 |
| Interquartile Range (IQR) | $9,304 | $11,847 |
| Standard Deviation (Sample) | $9,178 | $9,103 |
| Standard Deviation (Population) | $9,120 | $9,031 |
Demographics Similar to Liberians and Immigrants from Burma/Myanmar by Per Capita Income
In terms of per capita income, the demographic groups most similar to Liberians are Immigrants from Jamaica ($38,766, a difference of 0.040%), Immigrants from Zaire ($38,848, a difference of 0.17%), Salvadoran ($38,858, a difference of 0.20%), Spanish American ($39,012, a difference of 0.60%), and American ($39,039, a difference of 0.67%). Similarly, the demographic groups most similar to Immigrants from Burma/Myanmar are Samoan ($39,826, a difference of 0.0%), Japanese ($39,870, a difference of 0.11%), Immigrants from the Azores ($39,608, a difference of 0.55%), Osage ($39,568, a difference of 0.66%), and Alaska Native ($39,558, a difference of 0.68%).
| Demographics | Rating | Rank | Per Capita Income |
| Japanese | 1.4 /100 | #249 | Tragic $39,870 |
| Immigrants | Burma/Myanmar | 1.3 /100 | #250 | Tragic $39,827 |
| Samoans | 1.3 /100 | #251 | Tragic $39,826 |
| Immigrants | Azores | 1.0 /100 | #252 | Tragic $39,608 |
| Osage | 1.0 /100 | #253 | Tragic $39,568 |
| Alaska Natives | 1.0 /100 | #254 | Tragic $39,558 |
| Immigrants | Middle Africa | 1.0 /100 | #255 | Tragic $39,529 |
| Hawaiians | 0.8 /100 | #256 | Tragic $39,403 |
| Nicaraguans | 0.8 /100 | #257 | Tragic $39,372 |
| Jamaicans | 0.7 /100 | #258 | Tragic $39,231 |
| Malaysians | 0.7 /100 | #259 | Tragic $39,194 |
| Alaskan Athabascans | 0.6 /100 | #260 | Tragic $39,163 |
| Marshallese | 0.6 /100 | #261 | Tragic $39,108 |
| Iroquois | 0.6 /100 | #262 | Tragic $39,104 |
| Belizeans | 0.6 /100 | #263 | Tragic $39,097 |
| Americans | 0.6 /100 | #264 | Tragic $39,039 |
| Spanish Americans | 0.5 /100 | #265 | Tragic $39,012 |
| Salvadorans | 0.5 /100 | #266 | Tragic $38,858 |
| Immigrants | Zaire | 0.4 /100 | #267 | Tragic $38,848 |
| Liberians | 0.4 /100 | #268 | Tragic $38,780 |
| Immigrants | Jamaica | 0.4 /100 | #269 | Tragic $38,766 |