Liberian vs Immigrants from Burma/Myanmar Professional Degree
COMPARE
Liberian
Immigrants from Burma/Myanmar
Professional Degree
Professional Degree Comparison
Liberians
Immigrants from Burma/Myanmar
3.6%
PROFESSIONAL DEGREE
0.5/ 100
METRIC RATING
276th/ 347
METRIC RANK
3.9%
PROFESSIONAL DEGREE
5.4/ 100
METRIC RATING
229th/ 347
METRIC RANK
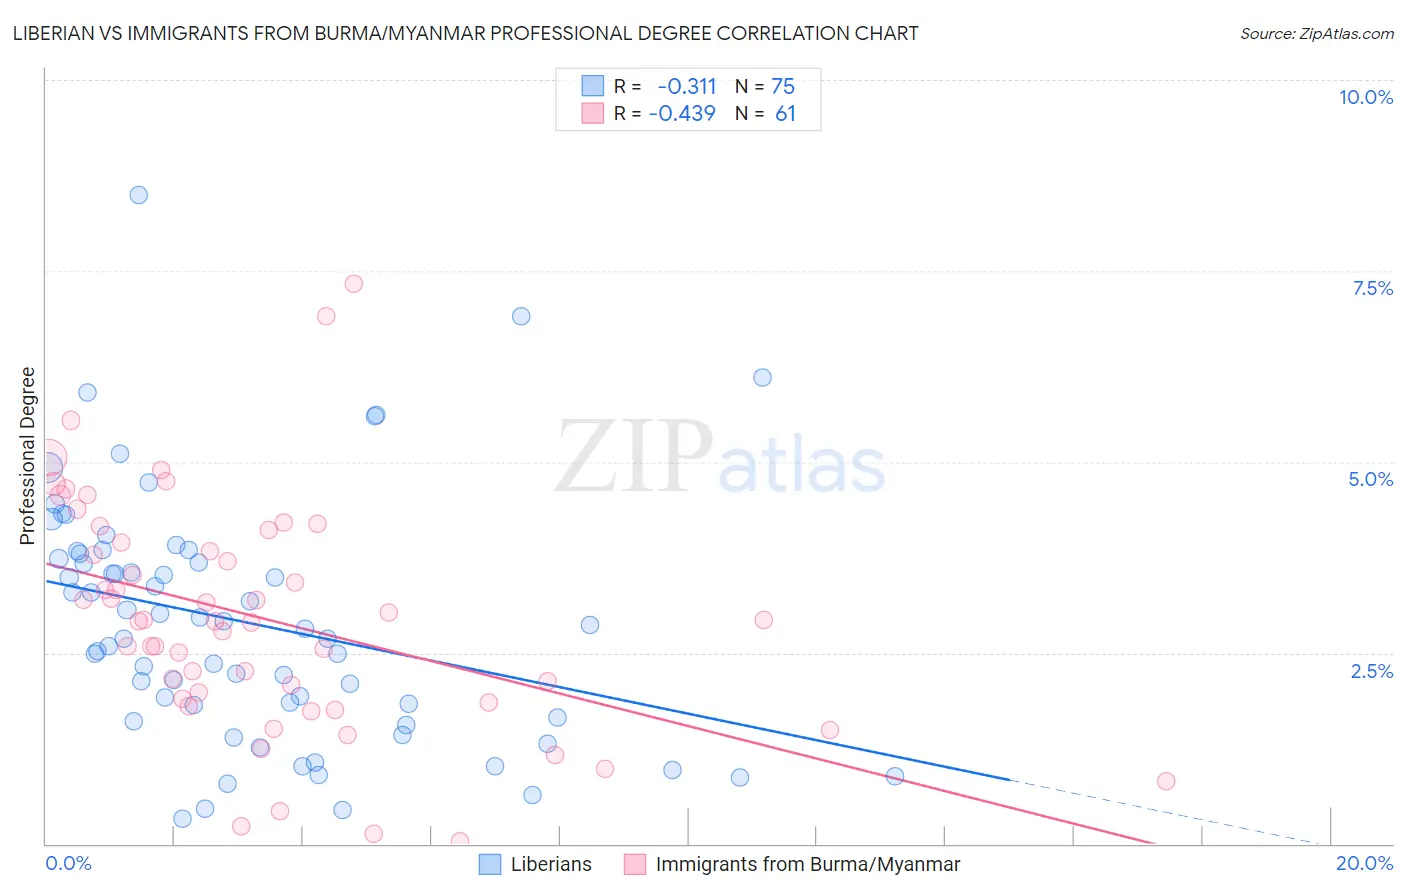
Liberian vs Immigrants from Burma/Myanmar Professional Degree Correlation Chart
The statistical analysis conducted on geographies consisting of 117,941,180 people shows a mild negative correlation between the proportion of Liberians and percentage of population with at least professional degree education in the United States with a correlation coefficient (R) of -0.311 and weighted average of 3.6%. Similarly, the statistical analysis conducted on geographies consisting of 172,191,729 people shows a moderate negative correlation between the proportion of Immigrants from Burma/Myanmar and percentage of population with at least professional degree education in the United States with a correlation coefficient (R) of -0.439 and weighted average of 3.9%, a difference of 11.2%.
Professional Degree Correlation Summary
| Measurement | Liberian | Immigrants from Burma/Myanmar |
| Minimum | 0.33% | 0.034% |
| Maximum | 8.5% | 7.3% |
| Range | 8.2% | 7.3% |
| Mean | 2.9% | 3.0% |
| Median | 2.8% | 2.9% |
| Interquartile 25% (IQ1) | 1.7% | 1.9% |
| Interquartile 75% (IQ3) | 3.8% | 4.0% |
| Interquartile Range (IQR) | 2.1% | 2.1% |
| Standard Deviation (Sample) | 1.6% | 1.5% |
| Standard Deviation (Population) | 1.6% | 1.5% |
Similar Demographics by Professional Degree
Demographics Similar to Liberians by Professional Degree
In terms of professional degree, the demographic groups most similar to Liberians are Cheyenne (3.6%, a difference of 0.010%), Immigrants from Dominica (3.6%, a difference of 0.050%), Japanese (3.5%, a difference of 0.070%), Immigrants from Portugal (3.5%, a difference of 0.11%), and Dominican (3.5%, a difference of 0.15%).
| Demographics | Rating | Rank | Professional Degree |
| Immigrants | Cuba | 0.6 /100 | #269 | Tragic 3.6% |
| Central Americans | 0.6 /100 | #270 | Tragic 3.6% |
| Belizeans | 0.5 /100 | #271 | Tragic 3.6% |
| Immigrants | Jamaica | 0.5 /100 | #272 | Tragic 3.6% |
| Americans | 0.5 /100 | #273 | Tragic 3.6% |
| Potawatomi | 0.5 /100 | #274 | Tragic 3.6% |
| Immigrants | Dominica | 0.5 /100 | #275 | Tragic 3.6% |
| Liberians | 0.5 /100 | #276 | Tragic 3.6% |
| Cheyenne | 0.5 /100 | #277 | Tragic 3.6% |
| Japanese | 0.5 /100 | #278 | Tragic 3.5% |
| Immigrants | Portugal | 0.5 /100 | #279 | Tragic 3.5% |
| Dominicans | 0.5 /100 | #280 | Tragic 3.5% |
| Apache | 0.5 /100 | #281 | Tragic 3.5% |
| Immigrants | Caribbean | 0.5 /100 | #282 | Tragic 3.5% |
| Comanche | 0.4 /100 | #283 | Tragic 3.5% |
Demographics Similar to Immigrants from Burma/Myanmar by Professional Degree
In terms of professional degree, the demographic groups most similar to Immigrants from Burma/Myanmar are Immigrants from West Indies (4.0%, a difference of 0.14%), Nicaraguan (3.9%, a difference of 0.27%), Cuban (4.0%, a difference of 0.39%), German Russian (4.0%, a difference of 0.52%), and Ecuadorian (3.9%, a difference of 0.73%).
| Demographics | Rating | Rank | Professional Degree |
| Immigrants | Western Africa | 7.5 /100 | #222 | Tragic 4.0% |
| Immigrants | Bosnia and Herzegovina | 7.4 /100 | #223 | Tragic 4.0% |
| Trinidadians and Tobagonians | 7.1 /100 | #224 | Tragic 4.0% |
| Tlingit-Haida | 6.9 /100 | #225 | Tragic 4.0% |
| German Russians | 6.1 /100 | #226 | Tragic 4.0% |
| Cubans | 5.9 /100 | #227 | Tragic 4.0% |
| Immigrants | West Indies | 5.6 /100 | #228 | Tragic 4.0% |
| Immigrants | Burma/Myanmar | 5.4 /100 | #229 | Tragic 3.9% |
| Nicaraguans | 5.1 /100 | #230 | Tragic 3.9% |
| Ecuadorians | 4.6 /100 | #231 | Tragic 3.9% |
| Cree | 4.3 /100 | #232 | Tragic 3.9% |
| Immigrants | Philippines | 4.1 /100 | #233 | Tragic 3.9% |
| Immigrants | Nonimmigrants | 4.0 /100 | #234 | Tragic 3.9% |
| Immigrants | Barbados | 4.0 /100 | #235 | Tragic 3.9% |
| Spanish Americans | 3.8 /100 | #236 | Tragic 3.9% |