Liberian vs Immigrants from the Azores Ambulatory Disability
COMPARE
Liberian
Immigrants from the Azores
Ambulatory Disability
Ambulatory Disability Comparison
Liberians
Immigrants from the Azores
6.3%
AMBULATORY DISABILITY
7.1/ 100
METRIC RATING
224th/ 347
METRIC RANK
7.1%
AMBULATORY DISABILITY
0.0/ 100
METRIC RATING
309th/ 347
METRIC RANK
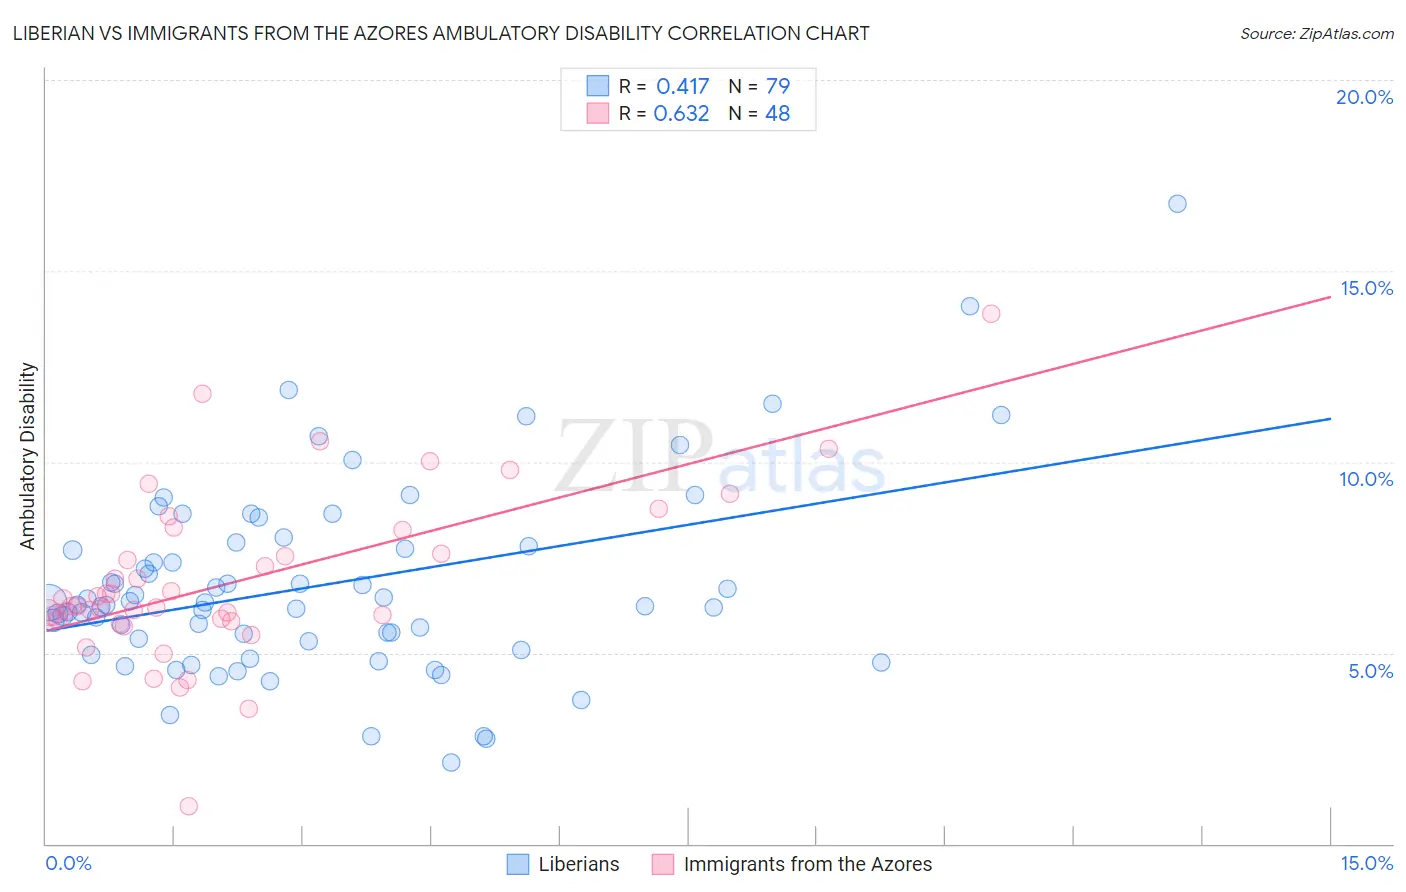
Liberian vs Immigrants from the Azores Ambulatory Disability Correlation Chart
The statistical analysis conducted on geographies consisting of 118,077,126 people shows a moderate positive correlation between the proportion of Liberians and percentage of population with ambulatory disability in the United States with a correlation coefficient (R) of 0.417 and weighted average of 6.3%. Similarly, the statistical analysis conducted on geographies consisting of 46,257,178 people shows a significant positive correlation between the proportion of Immigrants from the Azores and percentage of population with ambulatory disability in the United States with a correlation coefficient (R) of 0.632 and weighted average of 7.1%, a difference of 12.0%.
Ambulatory Disability Correlation Summary
| Measurement | Liberian | Immigrants from the Azores |
| Minimum | 2.1% | 0.99% |
| Maximum | 16.8% | 13.9% |
| Range | 14.6% | 12.9% |
| Mean | 6.8% | 6.8% |
| Median | 6.3% | 6.2% |
| Interquartile 25% (IQ1) | 5.3% | 5.9% |
| Interquartile 75% (IQ3) | 7.8% | 7.9% |
| Interquartile Range (IQR) | 2.5% | 2.0% |
| Standard Deviation (Sample) | 2.5% | 2.2% |
| Standard Deviation (Population) | 2.5% | 2.2% |
Similar Demographics by Ambulatory Disability
Demographics Similar to Liberians by Ambulatory Disability
In terms of ambulatory disability, the demographic groups most similar to Liberians are Immigrants from Honduras (6.3%, a difference of 0.10%), Honduran (6.3%, a difference of 0.17%), German Russian (6.3%, a difference of 0.39%), Immigrants from Albania (6.3%, a difference of 0.42%), and Hungarian (6.3%, a difference of 0.42%).
| Demographics | Rating | Rank | Ambulatory Disability |
| Yugoslavians | 10.9 /100 | #217 | Poor 6.3% |
| Guamanians/Chamorros | 10.6 /100 | #218 | Poor 6.3% |
| Indonesians | 9.9 /100 | #219 | Tragic 6.3% |
| Immigrants | Albania | 9.6 /100 | #220 | Tragic 6.3% |
| Hungarians | 9.6 /100 | #221 | Tragic 6.3% |
| German Russians | 9.4 /100 | #222 | Tragic 6.3% |
| Immigrants | Honduras | 7.6 /100 | #223 | Tragic 6.3% |
| Liberians | 7.1 /100 | #224 | Tragic 6.3% |
| Hondurans | 6.3 /100 | #225 | Tragic 6.3% |
| Slavs | 5.1 /100 | #226 | Tragic 6.4% |
| Cubans | 4.0 /100 | #227 | Tragic 6.4% |
| Portuguese | 4.0 /100 | #228 | Tragic 6.4% |
| Czechoslovakians | 3.8 /100 | #229 | Tragic 6.4% |
| Mexicans | 3.5 /100 | #230 | Tragic 6.4% |
| Panamanians | 3.1 /100 | #231 | Tragic 6.4% |
Demographics Similar to Immigrants from the Azores by Ambulatory Disability
In terms of ambulatory disability, the demographic groups most similar to Immigrants from the Azores are Spanish American (7.1%, a difference of 0.17%), Chippewa (7.1%, a difference of 0.17%), Arapaho (7.1%, a difference of 0.28%), Cree (7.1%, a difference of 0.29%), and Iroquois (7.1%, a difference of 0.44%).
| Demographics | Rating | Rank | Ambulatory Disability |
| Immigrants | Armenia | 0.0 /100 | #302 | Tragic 7.0% |
| Africans | 0.0 /100 | #303 | Tragic 7.0% |
| Immigrants | Cabo Verde | 0.0 /100 | #304 | Tragic 7.0% |
| Immigrants | Micronesia | 0.0 /100 | #305 | Tragic 7.0% |
| Iroquois | 0.0 /100 | #306 | Tragic 7.1% |
| Spanish Americans | 0.0 /100 | #307 | Tragic 7.1% |
| Chippewa | 0.0 /100 | #308 | Tragic 7.1% |
| Immigrants | Azores | 0.0 /100 | #309 | Tragic 7.1% |
| Arapaho | 0.0 /100 | #310 | Tragic 7.1% |
| Cree | 0.0 /100 | #311 | Tragic 7.1% |
| Delaware | 0.0 /100 | #312 | Tragic 7.1% |
| Immigrants | Yemen | 0.0 /100 | #313 | Tragic 7.1% |
| Blackfeet | 0.0 /100 | #314 | Tragic 7.1% |
| Shoshone | 0.0 /100 | #315 | Tragic 7.1% |
| Immigrants | Dominican Republic | 0.0 /100 | #316 | Tragic 7.1% |