Liberian vs Dutch West Indian Ambulatory Disability
COMPARE
Liberian
Dutch West Indian
Ambulatory Disability
Ambulatory Disability Comparison
Liberians
Dutch West Indians
6.3%
AMBULATORY DISABILITY
7.1/ 100
METRIC RATING
224th/ 347
METRIC RANK
8.2%
AMBULATORY DISABILITY
0.0/ 100
METRIC RATING
337th/ 347
METRIC RANK
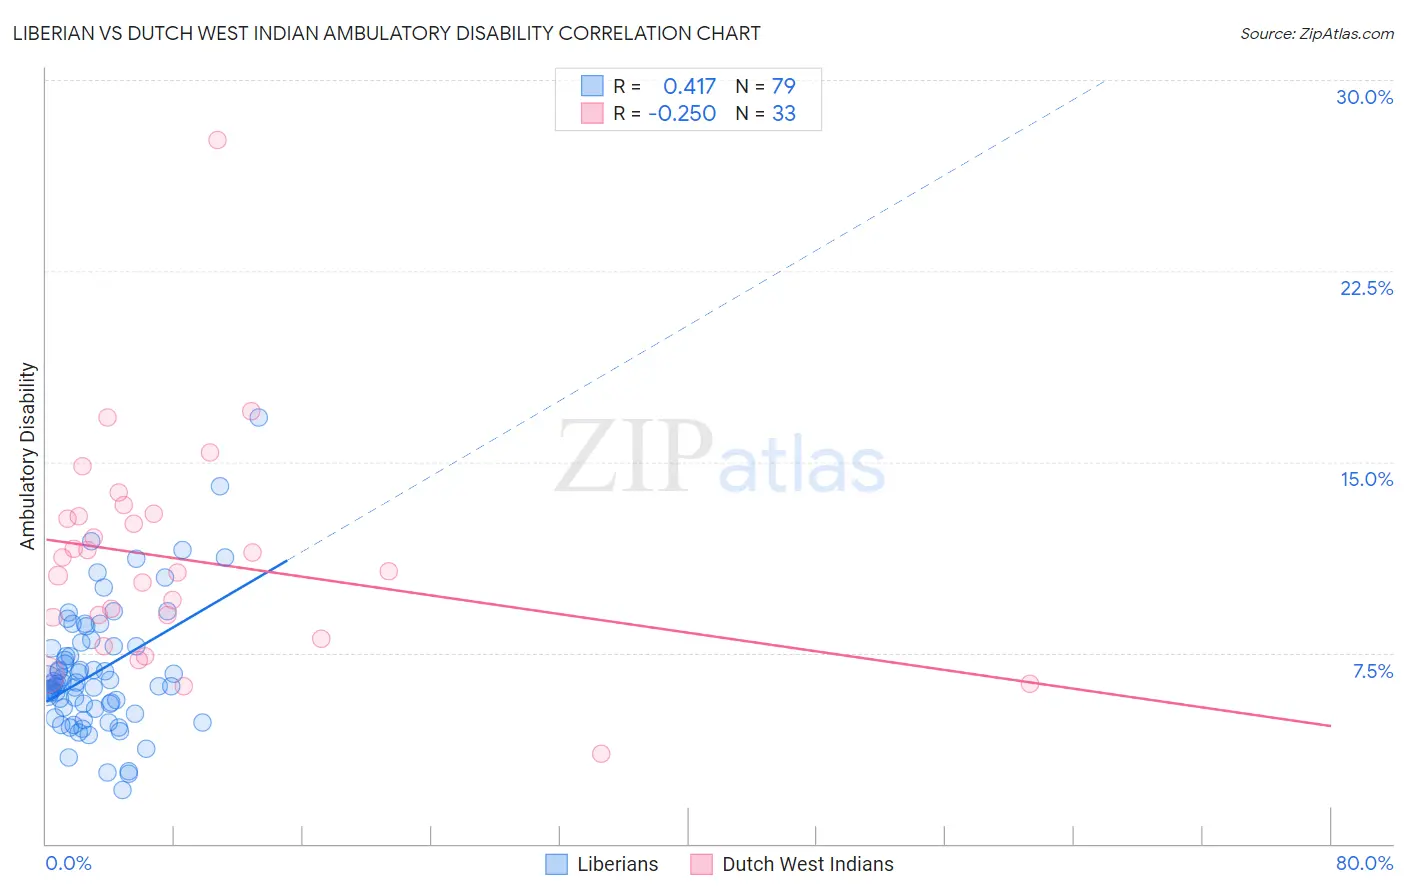
Liberian vs Dutch West Indian Ambulatory Disability Correlation Chart
The statistical analysis conducted on geographies consisting of 118,077,126 people shows a moderate positive correlation between the proportion of Liberians and percentage of population with ambulatory disability in the United States with a correlation coefficient (R) of 0.417 and weighted average of 6.3%. Similarly, the statistical analysis conducted on geographies consisting of 85,765,361 people shows a weak negative correlation between the proportion of Dutch West Indians and percentage of population with ambulatory disability in the United States with a correlation coefficient (R) of -0.250 and weighted average of 8.2%, a difference of 29.1%.
Ambulatory Disability Correlation Summary
| Measurement | Liberian | Dutch West Indian |
| Minimum | 2.1% | 3.6% |
| Maximum | 16.8% | 27.7% |
| Range | 14.6% | 24.1% |
| Mean | 6.8% | 11.2% |
| Median | 6.3% | 10.7% |
| Interquartile 25% (IQ1) | 5.3% | 8.5% |
| Interquartile 75% (IQ3) | 7.8% | 12.9% |
| Interquartile Range (IQR) | 2.5% | 4.4% |
| Standard Deviation (Sample) | 2.5% | 4.3% |
| Standard Deviation (Population) | 2.5% | 4.2% |
Similar Demographics by Ambulatory Disability
Demographics Similar to Liberians by Ambulatory Disability
In terms of ambulatory disability, the demographic groups most similar to Liberians are Immigrants from Honduras (6.3%, a difference of 0.10%), Honduran (6.3%, a difference of 0.17%), German Russian (6.3%, a difference of 0.39%), Immigrants from Albania (6.3%, a difference of 0.42%), and Hungarian (6.3%, a difference of 0.42%).
| Demographics | Rating | Rank | Ambulatory Disability |
| Yugoslavians | 10.9 /100 | #217 | Poor 6.3% |
| Guamanians/Chamorros | 10.6 /100 | #218 | Poor 6.3% |
| Indonesians | 9.9 /100 | #219 | Tragic 6.3% |
| Immigrants | Albania | 9.6 /100 | #220 | Tragic 6.3% |
| Hungarians | 9.6 /100 | #221 | Tragic 6.3% |
| German Russians | 9.4 /100 | #222 | Tragic 6.3% |
| Immigrants | Honduras | 7.6 /100 | #223 | Tragic 6.3% |
| Liberians | 7.1 /100 | #224 | Tragic 6.3% |
| Hondurans | 6.3 /100 | #225 | Tragic 6.3% |
| Slavs | 5.1 /100 | #226 | Tragic 6.4% |
| Cubans | 4.0 /100 | #227 | Tragic 6.4% |
| Portuguese | 4.0 /100 | #228 | Tragic 6.4% |
| Czechoslovakians | 3.8 /100 | #229 | Tragic 6.4% |
| Mexicans | 3.5 /100 | #230 | Tragic 6.4% |
| Panamanians | 3.1 /100 | #231 | Tragic 6.4% |
Demographics Similar to Dutch West Indians by Ambulatory Disability
In terms of ambulatory disability, the demographic groups most similar to Dutch West Indians are Colville (8.2%, a difference of 0.57%), Pima (8.2%, a difference of 0.92%), Seminole (8.0%, a difference of 1.6%), Chickasaw (8.0%, a difference of 1.7%), and Choctaw (8.3%, a difference of 1.8%).
| Demographics | Rating | Rank | Ambulatory Disability |
| Paiute | 0.0 /100 | #330 | Tragic 7.7% |
| Cajuns | 0.0 /100 | #331 | Tragic 7.8% |
| Menominee | 0.0 /100 | #332 | Tragic 7.8% |
| Cherokee | 0.0 /100 | #333 | Tragic 7.9% |
| Yuman | 0.0 /100 | #334 | Tragic 7.9% |
| Chickasaw | 0.0 /100 | #335 | Tragic 8.0% |
| Seminole | 0.0 /100 | #336 | Tragic 8.0% |
| Dutch West Indians | 0.0 /100 | #337 | Tragic 8.2% |
| Colville | 0.0 /100 | #338 | Tragic 8.2% |
| Pima | 0.0 /100 | #339 | Tragic 8.2% |
| Choctaw | 0.0 /100 | #340 | Tragic 8.3% |
| Creek | 0.0 /100 | #341 | Tragic 8.5% |
| Kiowa | 0.0 /100 | #342 | Tragic 8.6% |
| Tohono O'odham | 0.0 /100 | #343 | Tragic 8.7% |
| Tsimshian | 0.0 /100 | #344 | Tragic 8.8% |