Thai vs Immigrants from Burma/Myanmar Ambulatory Disability
COMPARE
Thai
Immigrants from Burma/Myanmar
Ambulatory Disability
Ambulatory Disability Comparison
Thais
Immigrants from Burma/Myanmar
4.9%
AMBULATORY DISABILITY
100.0/ 100
METRIC RATING
3rd/ 347
METRIC RANK
6.1%
AMBULATORY DISABILITY
52.2/ 100
METRIC RATING
172nd/ 347
METRIC RANK
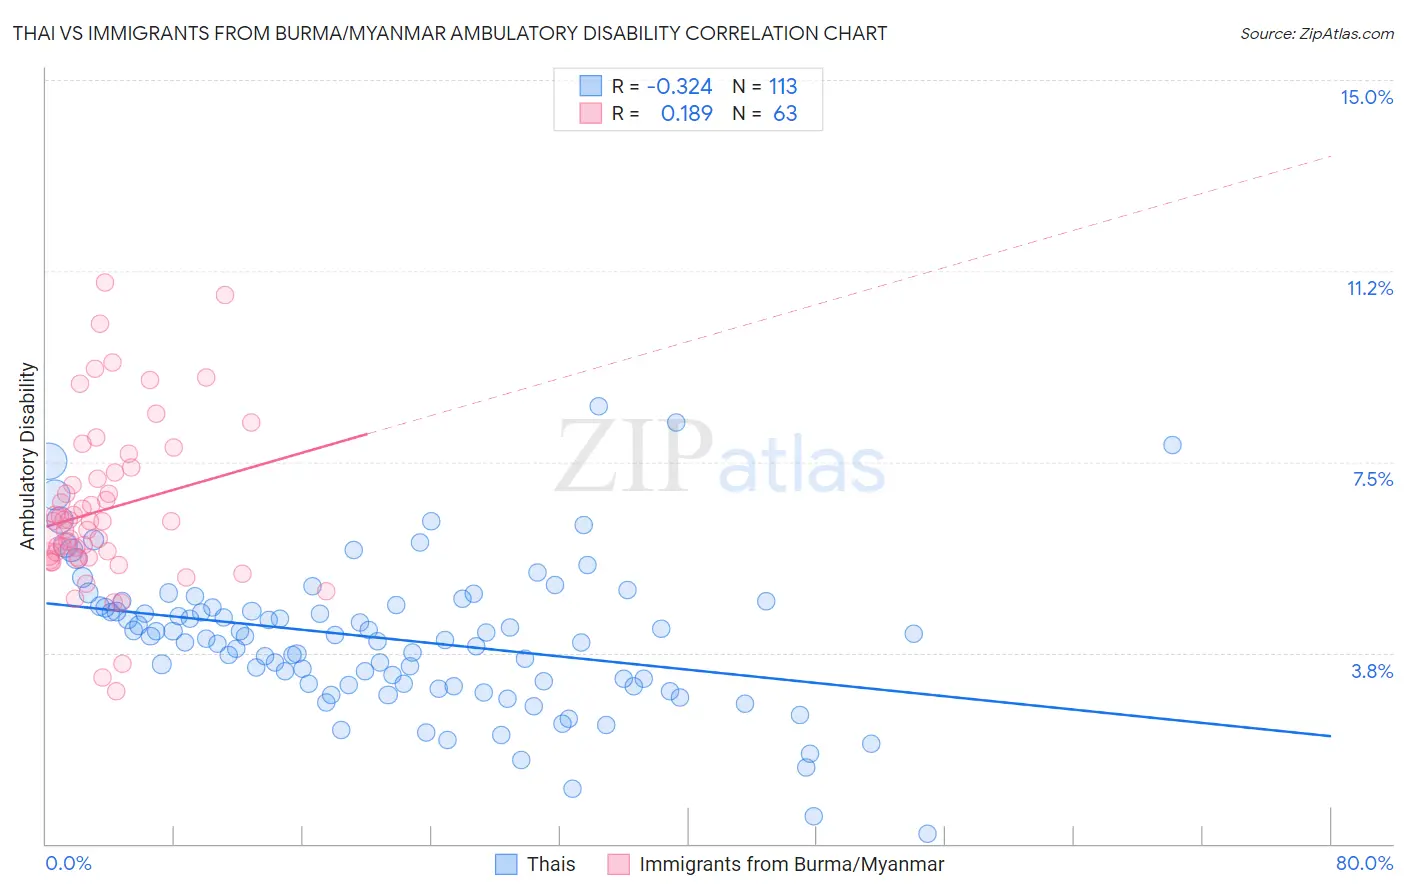
Thai vs Immigrants from Burma/Myanmar Ambulatory Disability Correlation Chart
The statistical analysis conducted on geographies consisting of 475,631,146 people shows a mild negative correlation between the proportion of Thais and percentage of population with ambulatory disability in the United States with a correlation coefficient (R) of -0.324 and weighted average of 4.9%. Similarly, the statistical analysis conducted on geographies consisting of 172,292,594 people shows a poor positive correlation between the proportion of Immigrants from Burma/Myanmar and percentage of population with ambulatory disability in the United States with a correlation coefficient (R) of 0.189 and weighted average of 6.1%, a difference of 24.1%.
Ambulatory Disability Correlation Summary
| Measurement | Thai | Immigrants from Burma/Myanmar |
| Minimum | 0.18% | 3.0% |
| Maximum | 8.6% | 11.0% |
| Range | 8.4% | 8.0% |
| Mean | 4.0% | 6.6% |
| Median | 4.1% | 6.3% |
| Interquartile 25% (IQ1) | 3.1% | 5.6% |
| Interquartile 75% (IQ3) | 4.7% | 7.3% |
| Interquartile Range (IQR) | 1.5% | 1.7% |
| Standard Deviation (Sample) | 1.4% | 1.6% |
| Standard Deviation (Population) | 1.4% | 1.6% |
Similar Demographics by Ambulatory Disability
Demographics Similar to Thais by Ambulatory Disability
In terms of ambulatory disability, the demographic groups most similar to Thais are Immigrants from Taiwan (4.9%, a difference of 0.24%), Filipino (4.9%, a difference of 1.2%), Immigrants from Singapore (5.0%, a difference of 1.6%), Immigrants from Bolivia (5.0%, a difference of 2.3%), and Bolivian (5.1%, a difference of 2.7%).
| Demographics | Rating | Rank | Ambulatory Disability |
| Immigrants | India | 100.0 /100 | #1 | Exceptional 4.8% |
| Filipinos | 100.0 /100 | #2 | Exceptional 4.9% |
| Thais | 100.0 /100 | #3 | Exceptional 4.9% |
| Immigrants | Taiwan | 100.0 /100 | #4 | Exceptional 4.9% |
| Immigrants | Singapore | 100.0 /100 | #5 | Exceptional 5.0% |
| Immigrants | Bolivia | 100.0 /100 | #6 | Exceptional 5.0% |
| Bolivians | 100.0 /100 | #7 | Exceptional 5.1% |
| Immigrants | South Central Asia | 100.0 /100 | #8 | Exceptional 5.1% |
| Iranians | 100.0 /100 | #9 | Exceptional 5.1% |
| Yup'ik | 100.0 /100 | #10 | Exceptional 5.2% |
| Immigrants | Korea | 100.0 /100 | #11 | Exceptional 5.2% |
| Okinawans | 100.0 /100 | #12 | Exceptional 5.3% |
| Burmese | 100.0 /100 | #13 | Exceptional 5.3% |
| Immigrants | Eastern Asia | 100.0 /100 | #14 | Exceptional 5.3% |
| Immigrants | China | 100.0 /100 | #15 | Exceptional 5.3% |
Demographics Similar to Immigrants from Burma/Myanmar by Ambulatory Disability
In terms of ambulatory disability, the demographic groups most similar to Immigrants from Burma/Myanmar are Moroccan (6.1%, a difference of 0.020%), Croatian (6.1%, a difference of 0.050%), Immigrants from Ecuador (6.1%, a difference of 0.090%), Immigrants from Canada (6.1%, a difference of 0.11%), and Vietnamese (6.1%, a difference of 0.26%).
| Demographics | Rating | Rank | Ambulatory Disability |
| Nicaraguans | 63.2 /100 | #165 | Good 6.1% |
| Iraqis | 62.8 /100 | #166 | Good 6.1% |
| Immigrants | Oceania | 60.7 /100 | #167 | Good 6.1% |
| Ecuadorians | 60.5 /100 | #168 | Good 6.1% |
| Immigrants | Southern Europe | 58.1 /100 | #169 | Average 6.1% |
| Immigrants | Ecuador | 53.8 /100 | #170 | Average 6.1% |
| Moroccans | 52.6 /100 | #171 | Average 6.1% |
| Immigrants | Burma/Myanmar | 52.2 /100 | #172 | Average 6.1% |
| Croatians | 51.2 /100 | #173 | Average 6.1% |
| Immigrants | Canada | 50.0 /100 | #174 | Average 6.1% |
| Vietnamese | 47.2 /100 | #175 | Average 6.1% |
| Immigrants | North America | 45.6 /100 | #176 | Average 6.1% |
| Immigrants | England | 45.4 /100 | #177 | Average 6.1% |
| Scandinavians | 44.5 /100 | #178 | Average 6.1% |
| Austrians | 44.1 /100 | #179 | Average 6.1% |