Liberian vs Immigrants from Burma/Myanmar Single Mother Poverty
COMPARE
Liberian
Immigrants from Burma/Myanmar
Single Mother Poverty
Single Mother Poverty Comparison
Liberians
Immigrants from Burma/Myanmar
29.9%
SINGLE MOTHER POVERTY
11.7/ 100
METRIC RATING
214th/ 347
METRIC RANK
30.6%
SINGLE MOTHER POVERTY
1.7/ 100
METRIC RATING
242nd/ 347
METRIC RANK
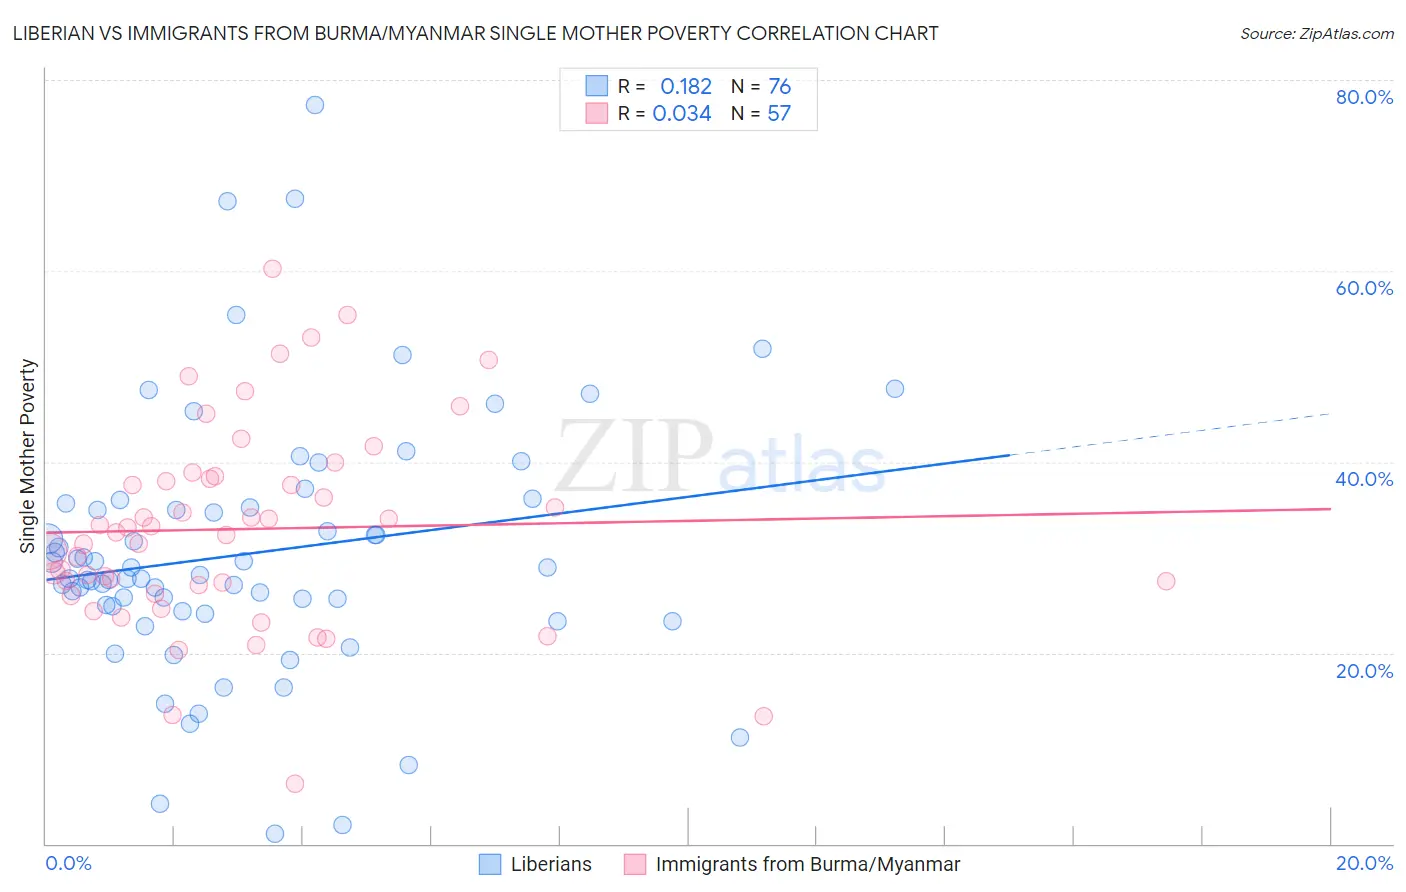
Liberian vs Immigrants from Burma/Myanmar Single Mother Poverty Correlation Chart
The statistical analysis conducted on geographies consisting of 117,524,642 people shows a poor positive correlation between the proportion of Liberians and poverty level among single mothers in the United States with a correlation coefficient (R) of 0.182 and weighted average of 29.9%. Similarly, the statistical analysis conducted on geographies consisting of 170,565,038 people shows no correlation between the proportion of Immigrants from Burma/Myanmar and poverty level among single mothers in the United States with a correlation coefficient (R) of 0.034 and weighted average of 30.6%, a difference of 2.4%.
Single Mother Poverty Correlation Summary
| Measurement | Liberian | Immigrants from Burma/Myanmar |
| Minimum | 1.1% | 6.2% |
| Maximum | 77.3% | 60.3% |
| Range | 76.3% | 54.0% |
| Mean | 30.4% | 33.0% |
| Median | 28.0% | 32.7% |
| Interquartile 25% (IQ1) | 24.7% | 26.6% |
| Interquartile 75% (IQ3) | 35.5% | 38.3% |
| Interquartile Range (IQR) | 10.8% | 11.7% |
| Standard Deviation (Sample) | 13.6% | 10.6% |
| Standard Deviation (Population) | 13.5% | 10.5% |
Similar Demographics by Single Mother Poverty
Demographics Similar to Liberians by Single Mother Poverty
In terms of single mother poverty, the demographic groups most similar to Liberians are Jamaican (29.9%, a difference of 0.0%), Immigrants from Western Africa (29.9%, a difference of 0.020%), Immigrants from Thailand (29.9%, a difference of 0.030%), Immigrants from Ghana (29.9%, a difference of 0.050%), and Nicaraguan (29.8%, a difference of 0.080%).
| Demographics | Rating | Rank | Single Mother Poverty |
| Immigrants | Panama | 15.5 /100 | #207 | Poor 29.8% |
| Immigrants | Guyana | 14.7 /100 | #208 | Poor 29.8% |
| Irish | 13.9 /100 | #209 | Poor 29.8% |
| Haitians | 13.3 /100 | #210 | Poor 29.8% |
| Guyanese | 12.8 /100 | #211 | Poor 29.8% |
| Nicaraguans | 12.4 /100 | #212 | Poor 29.8% |
| Immigrants | Thailand | 12.0 /100 | #213 | Poor 29.9% |
| Liberians | 11.7 /100 | #214 | Poor 29.9% |
| Jamaicans | 11.7 /100 | #215 | Poor 29.9% |
| Immigrants | Western Africa | 11.5 /100 | #216 | Poor 29.9% |
| Immigrants | Ghana | 11.3 /100 | #217 | Poor 29.9% |
| Hungarians | 10.3 /100 | #218 | Poor 29.9% |
| Finns | 9.3 /100 | #219 | Tragic 30.0% |
| Germans | 8.8 /100 | #220 | Tragic 30.0% |
| Immigrants | Eritrea | 7.7 /100 | #221 | Tragic 30.0% |
Demographics Similar to Immigrants from Burma/Myanmar by Single Mother Poverty
In terms of single mother poverty, the demographic groups most similar to Immigrants from Burma/Myanmar are Immigrants from Laos (30.6%, a difference of 0.020%), Salvadoran (30.6%, a difference of 0.070%), Bermudan (30.6%, a difference of 0.080%), Immigrants from Portugal (30.5%, a difference of 0.20%), and French (30.7%, a difference of 0.30%).
| Demographics | Rating | Rank | Single Mother Poverty |
| Immigrants | Grenada | 3.4 /100 | #235 | Tragic 30.3% |
| Welsh | 3.2 /100 | #236 | Tragic 30.4% |
| Immigrants | St. Vincent and the Grenadines | 3.1 /100 | #237 | Tragic 30.4% |
| Slovaks | 2.8 /100 | #238 | Tragic 30.4% |
| Immigrants | Portugal | 2.1 /100 | #239 | Tragic 30.5% |
| Salvadorans | 1.8 /100 | #240 | Tragic 30.6% |
| Immigrants | Laos | 1.8 /100 | #241 | Tragic 30.6% |
| Immigrants | Burma/Myanmar | 1.7 /100 | #242 | Tragic 30.6% |
| Bermudans | 1.6 /100 | #243 | Tragic 30.6% |
| French | 1.3 /100 | #244 | Tragic 30.7% |
| Barbadians | 1.3 /100 | #245 | Tragic 30.7% |
| Ecuadorians | 0.9 /100 | #246 | Tragic 30.8% |
| West Indians | 0.9 /100 | #247 | Tragic 30.8% |
| French Canadians | 0.9 /100 | #248 | Tragic 30.8% |
| Cape Verdeans | 0.8 /100 | #249 | Tragic 30.8% |