Bangladeshi vs Dutch West Indian Ambulatory Disability
COMPARE
Bangladeshi
Dutch West Indian
Ambulatory Disability
Ambulatory Disability Comparison
Bangladeshis
Dutch West Indians
6.3%
AMBULATORY DISABILITY
14.2/ 100
METRIC RATING
208th/ 347
METRIC RANK
8.2%
AMBULATORY DISABILITY
0.0/ 100
METRIC RATING
337th/ 347
METRIC RANK
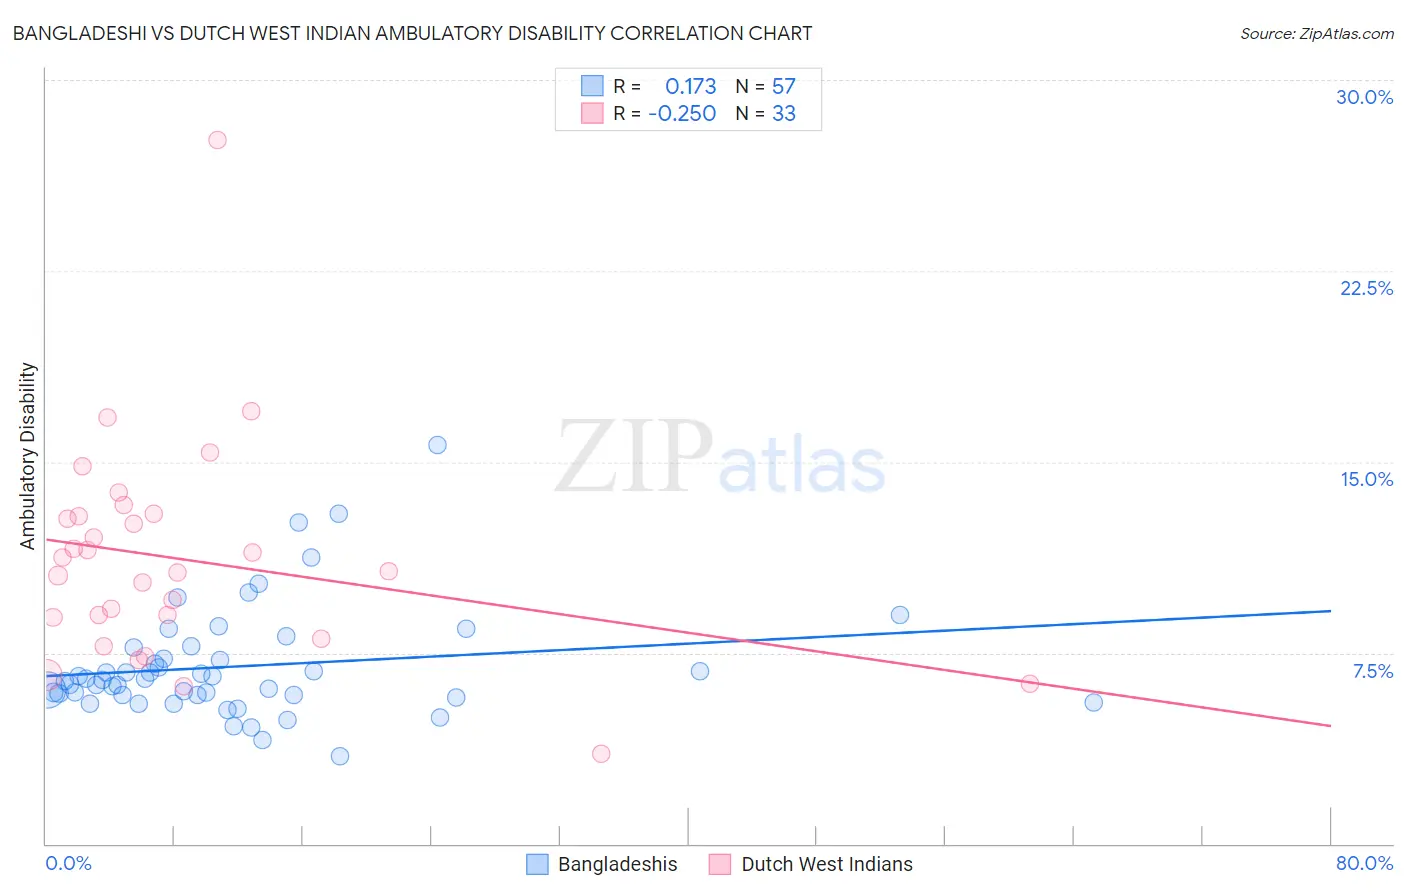
Bangladeshi vs Dutch West Indian Ambulatory Disability Correlation Chart
The statistical analysis conducted on geographies consisting of 141,368,014 people shows a poor positive correlation between the proportion of Bangladeshis and percentage of population with ambulatory disability in the United States with a correlation coefficient (R) of 0.173 and weighted average of 6.3%. Similarly, the statistical analysis conducted on geographies consisting of 85,765,361 people shows a weak negative correlation between the proportion of Dutch West Indians and percentage of population with ambulatory disability in the United States with a correlation coefficient (R) of -0.250 and weighted average of 8.2%, a difference of 30.4%.
Ambulatory Disability Correlation Summary
| Measurement | Bangladeshi | Dutch West Indian |
| Minimum | 3.4% | 3.6% |
| Maximum | 15.6% | 27.7% |
| Range | 12.2% | 24.1% |
| Mean | 7.0% | 11.2% |
| Median | 6.5% | 10.7% |
| Interquartile 25% (IQ1) | 5.8% | 8.5% |
| Interquartile 75% (IQ3) | 7.5% | 12.9% |
| Interquartile Range (IQR) | 1.6% | 4.4% |
| Standard Deviation (Sample) | 2.2% | 4.3% |
| Standard Deviation (Population) | 2.2% | 4.2% |
Similar Demographics by Ambulatory Disability
Demographics Similar to Bangladeshis by Ambulatory Disability
In terms of ambulatory disability, the demographic groups most similar to Bangladeshis are Immigrants from Iraq (6.3%, a difference of 0.020%), Alsatian (6.3%, a difference of 0.090%), Immigrants from Laos (6.3%, a difference of 0.10%), Samoan (6.3%, a difference of 0.24%), and Mexican American Indian (6.3%, a difference of 0.25%).
| Demographics | Rating | Rank | Ambulatory Disability |
| Immigrants | Central America | 20.1 /100 | #201 | Fair 6.2% |
| Albanians | 19.7 /100 | #202 | Poor 6.2% |
| Immigrants | Ukraine | 18.4 /100 | #203 | Poor 6.2% |
| Immigrants | Congo | 18.2 /100 | #204 | Poor 6.2% |
| Slovenes | 18.0 /100 | #205 | Poor 6.2% |
| Finns | 17.2 /100 | #206 | Poor 6.2% |
| Alsatians | 15.1 /100 | #207 | Poor 6.3% |
| Bangladeshis | 14.2 /100 | #208 | Poor 6.3% |
| Immigrants | Iraq | 14.0 /100 | #209 | Poor 6.3% |
| Immigrants | Laos | 13.2 /100 | #210 | Poor 6.3% |
| Samoans | 12.1 /100 | #211 | Poor 6.3% |
| Mexican American Indians | 12.0 /100 | #212 | Poor 6.3% |
| Japanese | 12.0 /100 | #213 | Poor 6.3% |
| Immigrants | Mexico | 11.0 /100 | #214 | Poor 6.3% |
| Immigrants | Latin America | 11.0 /100 | #215 | Poor 6.3% |
Demographics Similar to Dutch West Indians by Ambulatory Disability
In terms of ambulatory disability, the demographic groups most similar to Dutch West Indians are Colville (8.2%, a difference of 0.57%), Pima (8.2%, a difference of 0.92%), Seminole (8.0%, a difference of 1.6%), Chickasaw (8.0%, a difference of 1.7%), and Choctaw (8.3%, a difference of 1.8%).
| Demographics | Rating | Rank | Ambulatory Disability |
| Paiute | 0.0 /100 | #330 | Tragic 7.7% |
| Cajuns | 0.0 /100 | #331 | Tragic 7.8% |
| Menominee | 0.0 /100 | #332 | Tragic 7.8% |
| Cherokee | 0.0 /100 | #333 | Tragic 7.9% |
| Yuman | 0.0 /100 | #334 | Tragic 7.9% |
| Chickasaw | 0.0 /100 | #335 | Tragic 8.0% |
| Seminole | 0.0 /100 | #336 | Tragic 8.0% |
| Dutch West Indians | 0.0 /100 | #337 | Tragic 8.2% |
| Colville | 0.0 /100 | #338 | Tragic 8.2% |
| Pima | 0.0 /100 | #339 | Tragic 8.2% |
| Choctaw | 0.0 /100 | #340 | Tragic 8.3% |
| Creek | 0.0 /100 | #341 | Tragic 8.5% |
| Kiowa | 0.0 /100 | #342 | Tragic 8.6% |
| Tohono O'odham | 0.0 /100 | #343 | Tragic 8.7% |
| Tsimshian | 0.0 /100 | #344 | Tragic 8.8% |