Liberian vs Dutch West Indian Female Unemployment
COMPARE
Liberian
Dutch West Indian
Female Unemployment
Female Unemployment Comparison
Liberians
Dutch West Indians
5.5%
FEMALE UNEMPLOYMENT
3.9/ 100
METRIC RATING
232nd/ 347
METRIC RANK
5.7%
FEMALE UNEMPLOYMENT
0.3/ 100
METRIC RATING
257th/ 347
METRIC RANK
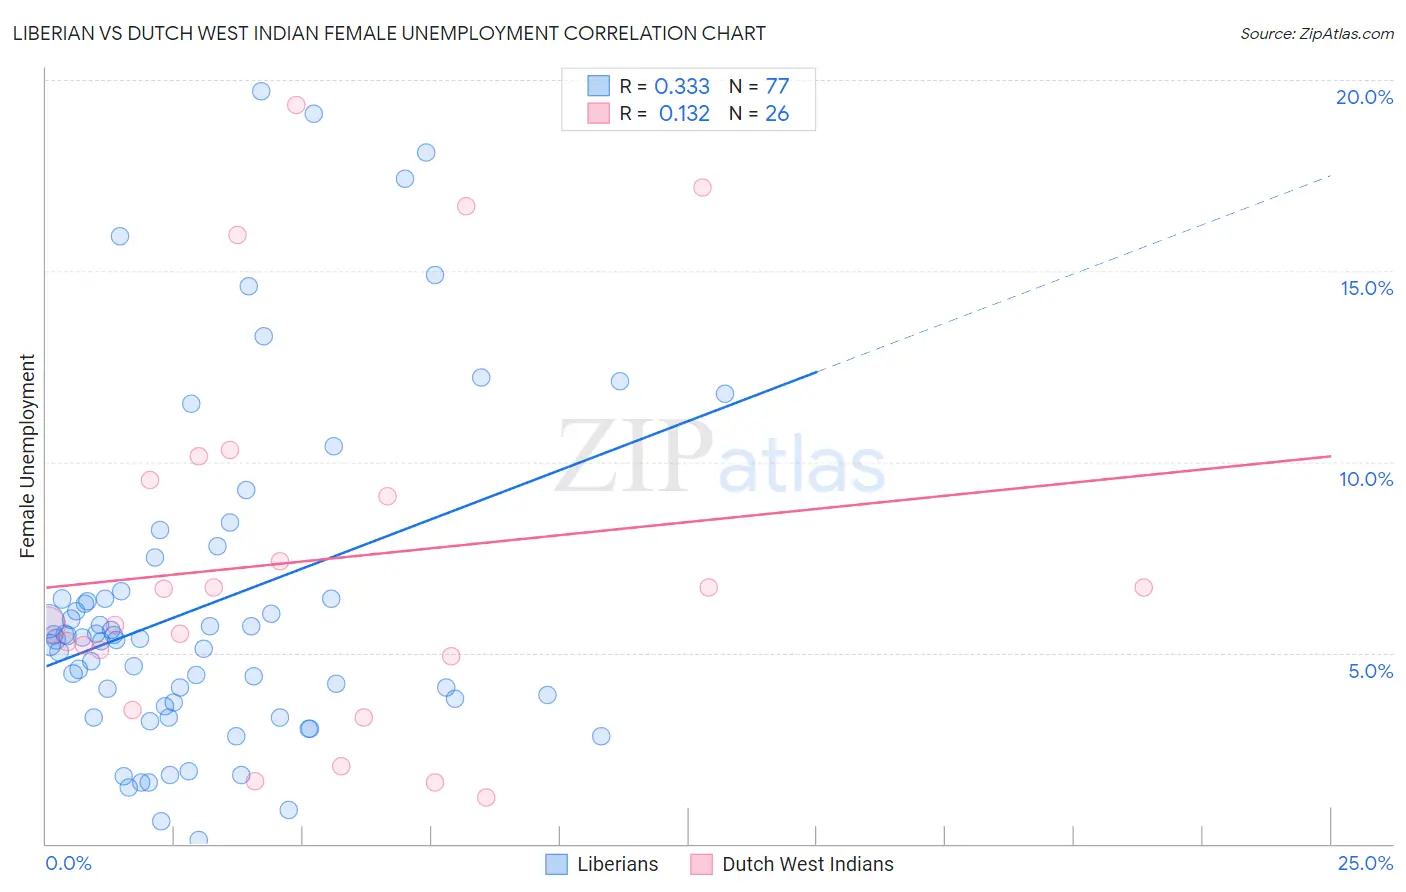
Liberian vs Dutch West Indian Female Unemployment Correlation Chart
The statistical analysis conducted on geographies consisting of 117,959,005 people shows a mild positive correlation between the proportion of Liberians and unemploymnet rate among females in the United States with a correlation coefficient (R) of 0.333 and weighted average of 5.5%. Similarly, the statistical analysis conducted on geographies consisting of 85,478,446 people shows a poor positive correlation between the proportion of Dutch West Indians and unemploymnet rate among females in the United States with a correlation coefficient (R) of 0.132 and weighted average of 5.7%, a difference of 3.5%.
Female Unemployment Correlation Summary
| Measurement | Liberian | Dutch West Indian |
| Minimum | 0.10% | 1.2% |
| Maximum | 19.7% | 19.3% |
| Range | 19.6% | 18.1% |
| Mean | 6.3% | 7.4% |
| Median | 5.4% | 6.2% |
| Interquartile 25% (IQ1) | 3.6% | 4.9% |
| Interquartile 75% (IQ3) | 6.5% | 9.5% |
| Interquartile Range (IQR) | 2.9% | 4.6% |
| Standard Deviation (Sample) | 4.4% | 5.0% |
| Standard Deviation (Population) | 4.4% | 4.9% |
Similar Demographics by Female Unemployment
Demographics Similar to Liberians by Female Unemployment
In terms of female unemployment, the demographic groups most similar to Liberians are Immigrants from Iraq (5.5%, a difference of 0.010%), Moroccan (5.5%, a difference of 0.21%), Immigrants from Lebanon (5.5%, a difference of 0.23%), Immigrants from Iran (5.5%, a difference of 0.23%), and Immigrants from Cambodia (5.5%, a difference of 0.27%).
| Demographics | Rating | Rank | Female Unemployment |
| French American Indians | 6.1 /100 | #225 | Tragic 5.5% |
| Immigrants | Peru | 5.9 /100 | #226 | Tragic 5.5% |
| Immigrants | Philippines | 5.3 /100 | #227 | Tragic 5.5% |
| Israelis | 4.8 /100 | #228 | Tragic 5.5% |
| Panamanians | 4.7 /100 | #229 | Tragic 5.5% |
| Immigrants | Uruguay | 4.7 /100 | #230 | Tragic 5.5% |
| Immigrants | Iraq | 3.9 /100 | #231 | Tragic 5.5% |
| Liberians | 3.9 /100 | #232 | Tragic 5.5% |
| Moroccans | 3.4 /100 | #233 | Tragic 5.5% |
| Immigrants | Lebanon | 3.3 /100 | #234 | Tragic 5.5% |
| Immigrants | Iran | 3.3 /100 | #235 | Tragic 5.5% |
| Immigrants | Cambodia | 3.3 /100 | #236 | Tragic 5.5% |
| Immigrants | Panama | 3.2 /100 | #237 | Tragic 5.5% |
| Sierra Leoneans | 3.2 /100 | #238 | Tragic 5.5% |
| Aleuts | 3.0 /100 | #239 | Tragic 5.5% |
Demographics Similar to Dutch West Indians by Female Unemployment
In terms of female unemployment, the demographic groups most similar to Dutch West Indians are Subsaharan African (5.7%, a difference of 0.070%), Immigrants from Cameroon (5.7%, a difference of 0.74%), Immigrants from Sierra Leone (5.7%, a difference of 0.78%), Immigrants (5.7%, a difference of 0.78%), and Immigrants from Portugal (5.8%, a difference of 0.81%).
| Demographics | Rating | Rank | Female Unemployment |
| Immigrants | Syria | 0.8 /100 | #250 | Tragic 5.6% |
| Assyrians/Chaldeans/Syriacs | 0.8 /100 | #251 | Tragic 5.6% |
| Cajuns | 0.7 /100 | #252 | Tragic 5.7% |
| Immigrants | Sierra Leone | 0.6 /100 | #253 | Tragic 5.7% |
| Immigrants | Immigrants | 0.6 /100 | #254 | Tragic 5.7% |
| Immigrants | Cameroon | 0.6 /100 | #255 | Tragic 5.7% |
| Sub-Saharan Africans | 0.4 /100 | #256 | Tragic 5.7% |
| Dutch West Indians | 0.3 /100 | #257 | Tragic 5.7% |
| Immigrants | Portugal | 0.2 /100 | #258 | Tragic 5.8% |
| Immigrants | Fiji | 0.2 /100 | #259 | Tragic 5.8% |
| Nigerians | 0.2 /100 | #260 | Tragic 5.8% |
| Kiowa | 0.1 /100 | #261 | Tragic 5.8% |
| Immigrants | Nigeria | 0.1 /100 | #262 | Tragic 5.8% |
| Immigrants | Azores | 0.1 /100 | #263 | Tragic 5.8% |
| Immigrants | Bahamas | 0.1 /100 | #264 | Tragic 5.8% |