Liberian vs Dutch West Indian Disability Age 18 to 34
COMPARE
Liberian
Dutch West Indian
Disability Age 18 to 34
Disability Age 18 to 34 Comparison
Liberians
Dutch West Indians
7.1%
DISABILITY AGE 18 TO 34
1.5/ 100
METRIC RATING
236th/ 347
METRIC RANK
8.4%
DISABILITY AGE 18 TO 34
0.0/ 100
METRIC RATING
334th/ 347
METRIC RANK
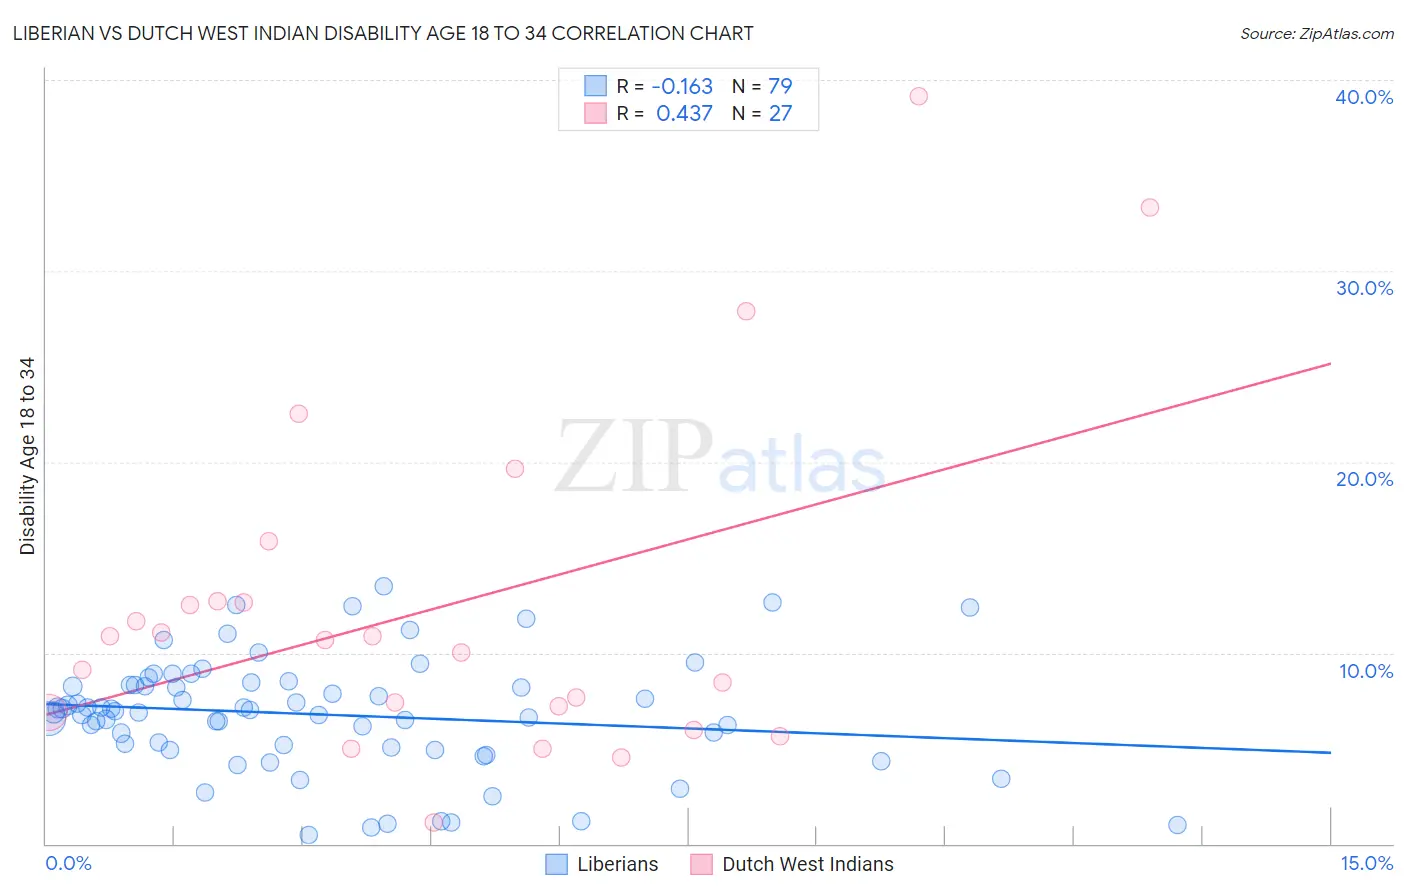
Liberian vs Dutch West Indian Disability Age 18 to 34 Correlation Chart
The statistical analysis conducted on geographies consisting of 118,043,713 people shows a poor negative correlation between the proportion of Liberians and percentage of population with a disability between the ages 18 and 35 in the United States with a correlation coefficient (R) of -0.163 and weighted average of 7.1%. Similarly, the statistical analysis conducted on geographies consisting of 85,713,308 people shows a moderate positive correlation between the proportion of Dutch West Indians and percentage of population with a disability between the ages 18 and 35 in the United States with a correlation coefficient (R) of 0.437 and weighted average of 8.4%, a difference of 19.1%.
Disability Age 18 to 34 Correlation Summary
| Measurement | Liberian | Dutch West Indian |
| Minimum | 0.47% | 1.1% |
| Maximum | 13.5% | 39.1% |
| Range | 13.0% | 38.0% |
| Mean | 6.8% | 12.4% |
| Median | 7.0% | 10.7% |
| Interquartile 25% (IQ1) | 5.0% | 6.9% |
| Interquartile 75% (IQ3) | 8.3% | 12.7% |
| Interquartile Range (IQR) | 3.3% | 5.8% |
| Standard Deviation (Sample) | 3.0% | 9.0% |
| Standard Deviation (Population) | 2.9% | 8.8% |
Similar Demographics by Disability Age 18 to 34
Demographics Similar to Liberians by Disability Age 18 to 34
In terms of disability age 18 to 34, the demographic groups most similar to Liberians are Austrian (7.1%, a difference of 0.17%), Marshallese (7.1%, a difference of 0.22%), Subsaharan African (7.1%, a difference of 0.25%), Italian (7.1%, a difference of 0.33%), and Arapaho (7.1%, a difference of 0.45%).
| Demographics | Rating | Rank | Disability Age 18 to 34 |
| Lithuanians | 4.1 /100 | #229 | Tragic 7.0% |
| Immigrants | North America | 3.9 /100 | #230 | Tragic 7.0% |
| Ute | 3.8 /100 | #231 | Tragic 7.0% |
| Samoans | 3.2 /100 | #232 | Tragic 7.0% |
| New Zealanders | 2.7 /100 | #233 | Tragic 7.0% |
| Alsatians | 2.1 /100 | #234 | Tragic 7.0% |
| Sub-Saharan Africans | 1.7 /100 | #235 | Tragic 7.1% |
| Liberians | 1.5 /100 | #236 | Tragic 7.1% |
| Austrians | 1.3 /100 | #237 | Tragic 7.1% |
| Marshallese | 1.3 /100 | #238 | Tragic 7.1% |
| Italians | 1.2 /100 | #239 | Tragic 7.1% |
| Arapaho | 1.1 /100 | #240 | Tragic 7.1% |
| Nepalese | 1.1 /100 | #241 | Tragic 7.1% |
| Immigrants | Congo | 1.1 /100 | #242 | Tragic 7.1% |
| Icelanders | 1.0 /100 | #243 | Tragic 7.1% |
Demographics Similar to Dutch West Indians by Disability Age 18 to 34
In terms of disability age 18 to 34, the demographic groups most similar to Dutch West Indians are Seminole (8.4%, a difference of 0.11%), Apache (8.4%, a difference of 0.21%), Puget Sound Salish (8.3%, a difference of 1.3%), Immigrants from the Azores (8.5%, a difference of 1.3%), and Comanche (8.3%, a difference of 1.5%).
| Demographics | Rating | Rank | Disability Age 18 to 34 |
| Sioux | 0.0 /100 | #327 | Tragic 8.2% |
| Delaware | 0.0 /100 | #328 | Tragic 8.2% |
| Crow | 0.0 /100 | #329 | Tragic 8.3% |
| Osage | 0.0 /100 | #330 | Tragic 8.3% |
| Comanche | 0.0 /100 | #331 | Tragic 8.3% |
| Puget Sound Salish | 0.0 /100 | #332 | Tragic 8.3% |
| Apache | 0.0 /100 | #333 | Tragic 8.4% |
| Dutch West Indians | 0.0 /100 | #334 | Tragic 8.4% |
| Seminole | 0.0 /100 | #335 | Tragic 8.4% |
| Immigrants | Azores | 0.0 /100 | #336 | Tragic 8.5% |
| Ottawa | 0.0 /100 | #337 | Tragic 8.6% |
| Cherokee | 0.0 /100 | #338 | Tragic 8.7% |
| Kiowa | 0.0 /100 | #339 | Tragic 8.8% |
| Choctaw | 0.0 /100 | #340 | Tragic 9.0% |
| Chickasaw | 0.0 /100 | #341 | Tragic 9.0% |