Korean vs Delaware Single Mother Poverty
COMPARE
Korean
Delaware
Single Mother Poverty
Single Mother Poverty Comparison
Koreans
Delaware
26.4%
SINGLE MOTHER POVERTY
100.0/ 100
METRIC RATING
28th/ 347
METRIC RANK
31.8%
SINGLE MOTHER POVERTY
0.0/ 100
METRIC RATING
276th/ 347
METRIC RANK
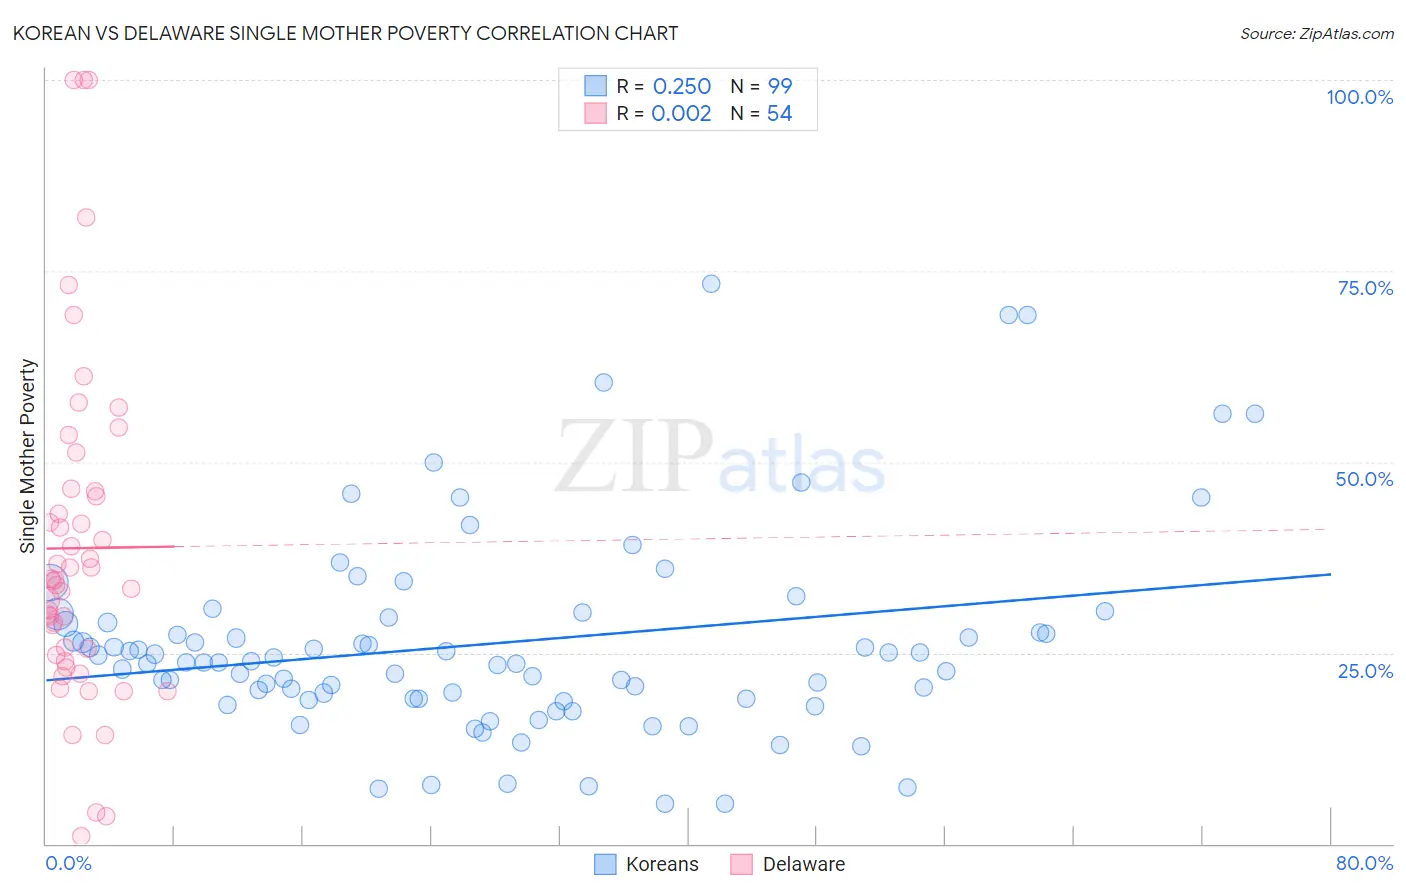
Korean vs Delaware Single Mother Poverty Correlation Chart
The statistical analysis conducted on geographies consisting of 493,220,076 people shows a weak positive correlation between the proportion of Koreans and poverty level among single mothers in the United States with a correlation coefficient (R) of 0.250 and weighted average of 26.4%. Similarly, the statistical analysis conducted on geographies consisting of 95,376,359 people shows no correlation between the proportion of Delaware and poverty level among single mothers in the United States with a correlation coefficient (R) of 0.002 and weighted average of 31.8%, a difference of 20.6%.
Single Mother Poverty Correlation Summary
| Measurement | Korean | Delaware |
| Minimum | 5.2% | 1.1% |
| Maximum | 73.4% | 100.0% |
| Range | 68.2% | 98.9% |
| Mean | 26.2% | 38.7% |
| Median | 23.8% | 34.5% |
| Interquartile 25% (IQ1) | 19.0% | 24.8% |
| Interquartile 75% (IQ3) | 29.0% | 46.2% |
| Interquartile Range (IQR) | 10.0% | 21.4% |
| Standard Deviation (Sample) | 13.2% | 22.2% |
| Standard Deviation (Population) | 13.1% | 21.9% |
Similar Demographics by Single Mother Poverty
Demographics Similar to Koreans by Single Mother Poverty
In terms of single mother poverty, the demographic groups most similar to Koreans are Immigrants from Japan (26.4%, a difference of 0.010%), Jordanian (26.4%, a difference of 0.050%), Turkish (26.4%, a difference of 0.14%), Immigrants from Sri Lanka (26.3%, a difference of 0.24%), and Immigrants from Philippines (26.5%, a difference of 0.30%).
| Demographics | Rating | Rank | Single Mother Poverty |
| Immigrants | Bolivia | 100.0 /100 | #21 | Exceptional 26.2% |
| Immigrants | Korea | 100.0 /100 | #22 | Exceptional 26.2% |
| Burmese | 100.0 /100 | #23 | Exceptional 26.2% |
| Immigrants | Moldova | 100.0 /100 | #24 | Exceptional 26.2% |
| Immigrants | Asia | 100.0 /100 | #25 | Exceptional 26.3% |
| Immigrants | Sri Lanka | 100.0 /100 | #26 | Exceptional 26.3% |
| Immigrants | Japan | 100.0 /100 | #27 | Exceptional 26.4% |
| Koreans | 100.0 /100 | #28 | Exceptional 26.4% |
| Jordanians | 100.0 /100 | #29 | Exceptional 26.4% |
| Turks | 100.0 /100 | #30 | Exceptional 26.4% |
| Immigrants | Philippines | 100.0 /100 | #31 | Exceptional 26.5% |
| Tongans | 99.9 /100 | #32 | Exceptional 26.5% |
| Bulgarians | 99.9 /100 | #33 | Exceptional 26.5% |
| Immigrants | Indonesia | 99.9 /100 | #34 | Exceptional 26.6% |
| Maltese | 99.9 /100 | #35 | Exceptional 26.6% |
Demographics Similar to Delaware by Single Mother Poverty
In terms of single mother poverty, the demographic groups most similar to Delaware are Central American (31.8%, a difference of 0.16%), Mexican American Indian (31.9%, a difference of 0.21%), Bangladeshi (31.7%, a difference of 0.35%), Immigrants from Zaire (32.0%, a difference of 0.43%), and Fijian (31.6%, a difference of 0.58%).
| Demographics | Rating | Rank | Single Mother Poverty |
| Scotch-Irish | 0.1 /100 | #269 | Tragic 31.5% |
| British West Indians | 0.1 /100 | #270 | Tragic 31.5% |
| Immigrants | Cabo Verde | 0.1 /100 | #271 | Tragic 31.6% |
| Immigrants | Micronesia | 0.1 /100 | #272 | Tragic 31.6% |
| Fijians | 0.1 /100 | #273 | Tragic 31.6% |
| Bangladeshis | 0.1 /100 | #274 | Tragic 31.7% |
| Central Americans | 0.1 /100 | #275 | Tragic 31.8% |
| Delaware | 0.0 /100 | #276 | Tragic 31.8% |
| Mexican American Indians | 0.0 /100 | #277 | Tragic 31.9% |
| Immigrants | Zaire | 0.0 /100 | #278 | Tragic 32.0% |
| Marshallese | 0.0 /100 | #279 | Tragic 32.1% |
| Immigrants | Nonimmigrants | 0.0 /100 | #280 | Tragic 32.2% |
| Cree | 0.0 /100 | #281 | Tragic 32.2% |
| Immigrants | Azores | 0.0 /100 | #282 | Tragic 32.2% |
| Spanish Americans | 0.0 /100 | #283 | Tragic 32.3% |