Kiowa vs Immigrants from Eritrea Self-Care Disability
COMPARE
Kiowa
Immigrants from Eritrea
Self-Care Disability
Self-Care Disability Comparison
Kiowa
Immigrants from Eritrea
3.0%
SELF-CARE DISABILITY
0.0/ 100
METRIC RATING
332nd/ 347
METRIC RANK
2.2%
SELF-CARE DISABILITY
100.0/ 100
METRIC RATING
19th/ 347
METRIC RANK
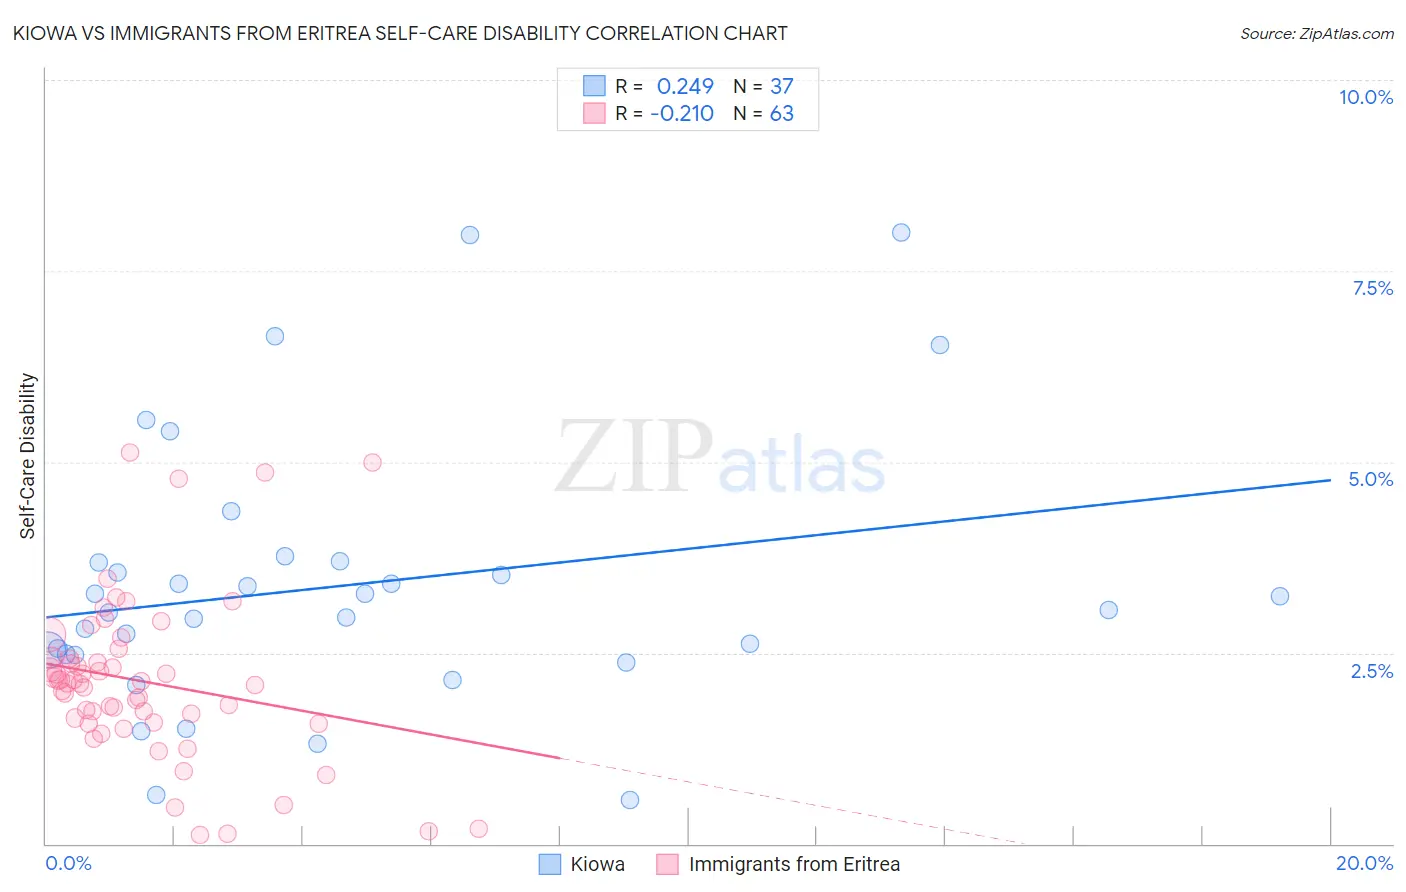
Kiowa vs Immigrants from Eritrea Self-Care Disability Correlation Chart
The statistical analysis conducted on geographies consisting of 56,085,215 people shows a weak positive correlation between the proportion of Kiowa and percentage of population with self-care disability in the United States with a correlation coefficient (R) of 0.249 and weighted average of 3.0%. Similarly, the statistical analysis conducted on geographies consisting of 104,840,277 people shows a weak negative correlation between the proportion of Immigrants from Eritrea and percentage of population with self-care disability in the United States with a correlation coefficient (R) of -0.210 and weighted average of 2.2%, a difference of 34.1%.
Self-Care Disability Correlation Summary
| Measurement | Kiowa | Immigrants from Eritrea |
| Minimum | 0.57% | 0.11% |
| Maximum | 8.0% | 5.1% |
| Range | 7.4% | 5.0% |
| Mean | 3.4% | 2.1% |
| Median | 3.1% | 2.1% |
| Interquartile 25% (IQ1) | 2.5% | 1.6% |
| Interquartile 75% (IQ3) | 3.7% | 2.4% |
| Interquartile Range (IQR) | 1.2% | 0.85% |
| Standard Deviation (Sample) | 1.7% | 1.1% |
| Standard Deviation (Population) | 1.7% | 1.1% |
Similar Demographics by Self-Care Disability
Demographics Similar to Kiowa by Self-Care Disability
In terms of self-care disability, the demographic groups most similar to Kiowa are Dutch West Indian (3.0%, a difference of 0.23%), Houma (3.0%, a difference of 0.30%), Immigrants from the Azores (3.0%, a difference of 0.35%), Lumbee (3.0%, a difference of 0.36%), and Nepalese (3.0%, a difference of 0.47%).
| Demographics | Rating | Rank | Self-Care Disability |
| Immigrants | Uzbekistan | 0.0 /100 | #325 | Tragic 2.9% |
| Paiute | 0.0 /100 | #326 | Tragic 2.9% |
| Blacks/African Americans | 0.0 /100 | #327 | Tragic 2.9% |
| Hopi | 0.0 /100 | #328 | Tragic 2.9% |
| Cajuns | 0.0 /100 | #329 | Tragic 2.9% |
| Nepalese | 0.0 /100 | #330 | Tragic 3.0% |
| Lumbee | 0.0 /100 | #331 | Tragic 3.0% |
| Kiowa | 0.0 /100 | #332 | Tragic 3.0% |
| Dutch West Indians | 0.0 /100 | #333 | Tragic 3.0% |
| Houma | 0.0 /100 | #334 | Tragic 3.0% |
| Immigrants | Azores | 0.0 /100 | #335 | Tragic 3.0% |
| Immigrants | Yemen | 0.0 /100 | #336 | Tragic 3.0% |
| Choctaw | 0.0 /100 | #337 | Tragic 3.0% |
| Cape Verdeans | 0.0 /100 | #338 | Tragic 3.0% |
| Immigrants | Dominican Republic | 0.0 /100 | #339 | Tragic 3.0% |
Demographics Similar to Immigrants from Eritrea by Self-Care Disability
In terms of self-care disability, the demographic groups most similar to Immigrants from Eritrea are Tongan (2.2%, a difference of 0.080%), Immigrants from Taiwan (2.2%, a difference of 0.33%), Bulgarian (2.2%, a difference of 0.33%), Immigrants from Venezuela (2.2%, a difference of 0.36%), and Cambodian (2.2%, a difference of 0.58%).
| Demographics | Rating | Rank | Self-Care Disability |
| Immigrants | Ethiopia | 100.0 /100 | #12 | Exceptional 2.2% |
| Ethiopians | 100.0 /100 | #13 | Exceptional 2.2% |
| Luxembourgers | 100.0 /100 | #14 | Exceptional 2.2% |
| Okinawans | 100.0 /100 | #15 | Exceptional 2.2% |
| Immigrants | Kuwait | 100.0 /100 | #16 | Exceptional 2.2% |
| Immigrants | Saudi Arabia | 100.0 /100 | #17 | Exceptional 2.2% |
| Immigrants | Taiwan | 100.0 /100 | #18 | Exceptional 2.2% |
| Immigrants | Eritrea | 100.0 /100 | #19 | Exceptional 2.2% |
| Tongans | 100.0 /100 | #20 | Exceptional 2.2% |
| Bulgarians | 100.0 /100 | #21 | Exceptional 2.2% |
| Immigrants | Venezuela | 100.0 /100 | #22 | Exceptional 2.2% |
| Cambodians | 100.0 /100 | #23 | Exceptional 2.2% |
| Cypriots | 100.0 /100 | #24 | Exceptional 2.2% |
| Turks | 100.0 /100 | #25 | Exceptional 2.2% |
| Immigrants | Sri Lanka | 99.9 /100 | #26 | Exceptional 2.2% |