Kenyan vs Seminole Disability Age 5 to 17
COMPARE
Kenyan
Seminole
Disability Age 5 to 17
Disability Age 5 to 17 Comparison
Kenyans
Seminole
5.8%
DISABILITY AGE 5 TO 17
10.0/ 100
METRIC RATING
208th/ 347
METRIC RANK
6.8%
DISABILITY AGE 5 TO 17
0.0/ 100
METRIC RATING
334th/ 347
METRIC RANK
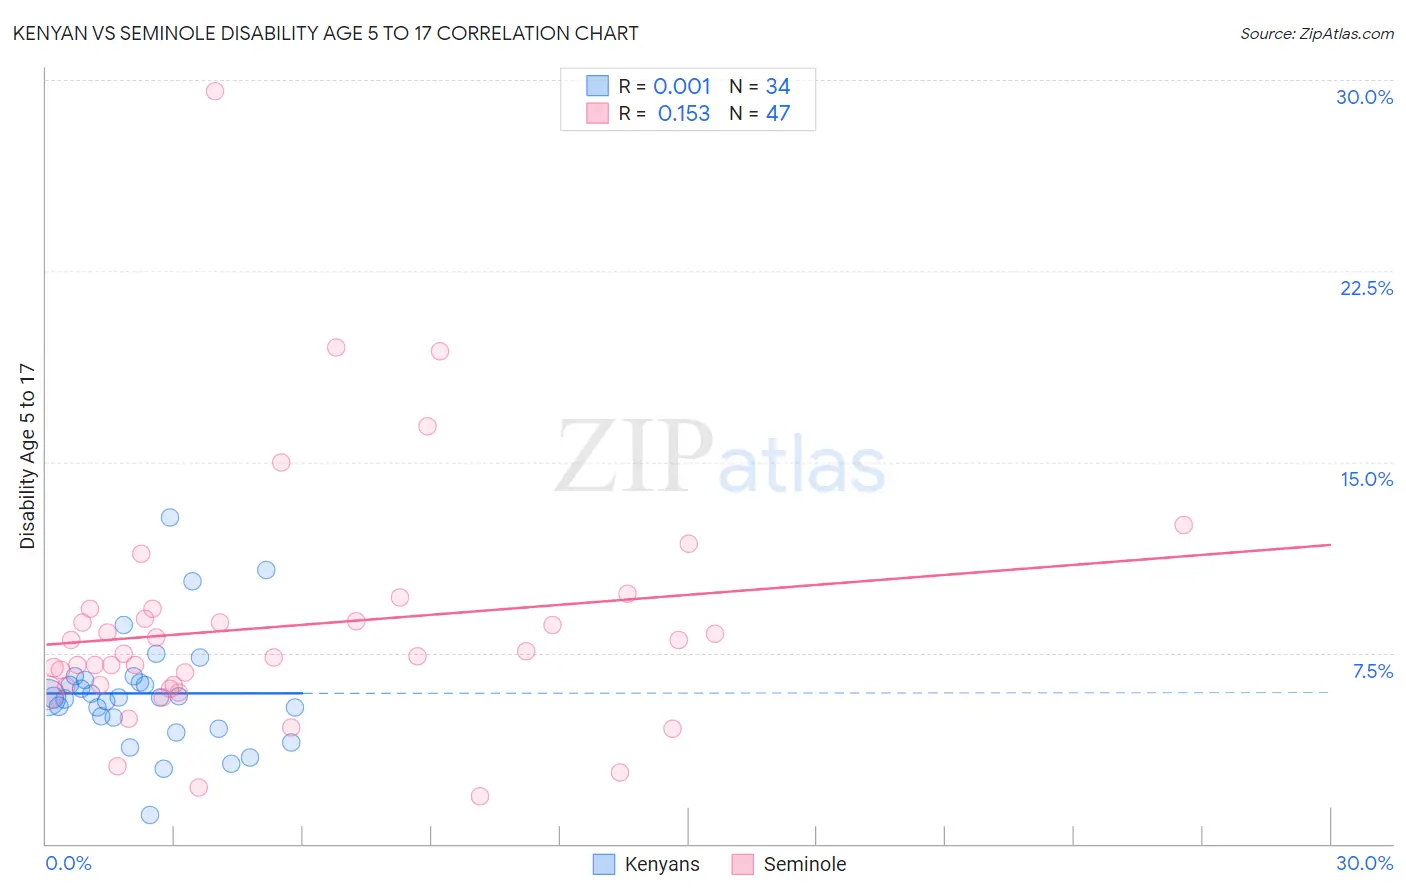
Kenyan vs Seminole Disability Age 5 to 17 Correlation Chart
The statistical analysis conducted on geographies consisting of 167,701,588 people shows no correlation between the proportion of Kenyans and percentage of population with a disability between the ages 5 and 17 in the United States with a correlation coefficient (R) of 0.001 and weighted average of 5.8%. Similarly, the statistical analysis conducted on geographies consisting of 117,971,284 people shows a poor positive correlation between the proportion of Seminole and percentage of population with a disability between the ages 5 and 17 in the United States with a correlation coefficient (R) of 0.153 and weighted average of 6.8%, a difference of 17.5%.
Disability Age 5 to 17 Correlation Summary
| Measurement | Kenyan | Seminole |
| Minimum | 1.1% | 1.9% |
| Maximum | 12.8% | 29.5% |
| Range | 11.7% | 27.7% |
| Mean | 5.9% | 8.6% |
| Median | 5.7% | 7.5% |
| Interquartile 25% (IQ1) | 5.0% | 6.2% |
| Interquartile 75% (IQ3) | 6.4% | 9.2% |
| Interquartile Range (IQR) | 1.5% | 3.0% |
| Standard Deviation (Sample) | 2.2% | 4.8% |
| Standard Deviation (Population) | 2.2% | 4.8% |
Similar Demographics by Disability Age 5 to 17
Demographics Similar to Kenyans by Disability Age 5 to 17
In terms of disability age 5 to 17, the demographic groups most similar to Kenyans are Immigrants from Uganda (5.8%, a difference of 0.040%), Moroccan (5.7%, a difference of 0.050%), Immigrants from Haiti (5.8%, a difference of 0.070%), Trinidadian and Tobagonian (5.7%, a difference of 0.10%), and Immigrants from Africa (5.7%, a difference of 0.10%).
| Demographics | Rating | Rank | Disability Age 5 to 17 |
| Basques | 13.7 /100 | #201 | Poor 5.7% |
| Austrians | 13.2 /100 | #202 | Poor 5.7% |
| Spanish American Indians | 12.8 /100 | #203 | Poor 5.7% |
| Paiute | 11.2 /100 | #204 | Poor 5.7% |
| Trinidadians and Tobagonians | 10.8 /100 | #205 | Poor 5.7% |
| Immigrants | Africa | 10.8 /100 | #206 | Poor 5.7% |
| Moroccans | 10.4 /100 | #207 | Poor 5.7% |
| Kenyans | 10.0 /100 | #208 | Poor 5.8% |
| Immigrants | Uganda | 9.7 /100 | #209 | Tragic 5.8% |
| Immigrants | Haiti | 9.5 /100 | #210 | Tragic 5.8% |
| Yugoslavians | 9.1 /100 | #211 | Tragic 5.8% |
| Immigrants | Panama | 8.7 /100 | #212 | Tragic 5.8% |
| Immigrants | Cameroon | 8.3 /100 | #213 | Tragic 5.8% |
| Immigrants | Morocco | 8.3 /100 | #214 | Tragic 5.8% |
| Swedes | 8.1 /100 | #215 | Tragic 5.8% |
Demographics Similar to Seminole by Disability Age 5 to 17
In terms of disability age 5 to 17, the demographic groups most similar to Seminole are Black/African American (6.8%, a difference of 0.050%), Immigrants from the Azores (6.7%, a difference of 0.64%), French Canadian (6.7%, a difference of 0.66%), Ottawa (6.8%, a difference of 0.70%), and Dutch West Indian (6.7%, a difference of 0.74%).
| Demographics | Rating | Rank | Disability Age 5 to 17 |
| French American Indians | 0.0 /100 | #327 | Tragic 6.6% |
| Pennsylvania Germans | 0.0 /100 | #328 | Tragic 6.6% |
| Blackfeet | 0.0 /100 | #329 | Tragic 6.6% |
| Dutch West Indians | 0.0 /100 | #330 | Tragic 6.7% |
| French Canadians | 0.0 /100 | #331 | Tragic 6.7% |
| Immigrants | Azores | 0.0 /100 | #332 | Tragic 6.7% |
| Blacks/African Americans | 0.0 /100 | #333 | Tragic 6.8% |
| Seminole | 0.0 /100 | #334 | Tragic 6.8% |
| Ottawa | 0.0 /100 | #335 | Tragic 6.8% |
| Chickasaw | 0.0 /100 | #336 | Tragic 6.8% |
| Creek | 0.0 /100 | #337 | Tragic 6.9% |
| Iroquois | 0.0 /100 | #338 | Tragic 6.9% |
| Choctaw | 0.0 /100 | #339 | Tragic 6.9% |
| Cherokee | 0.0 /100 | #340 | Tragic 6.9% |
| Cape Verdeans | 0.0 /100 | #341 | Tragic 7.0% |