Kenyan vs Seminole Average Family Size
COMPARE
Kenyan
Seminole
Average Family Size
Average Family Size Comparison
Kenyans
Seminole
3.21
AVERAGE FAMILY SIZE
28.0/ 100
METRIC RATING
197th/ 347
METRIC RANK
3.24
AVERAGE FAMILY SIZE
68.2/ 100
METRIC RATING
155th/ 347
METRIC RANK
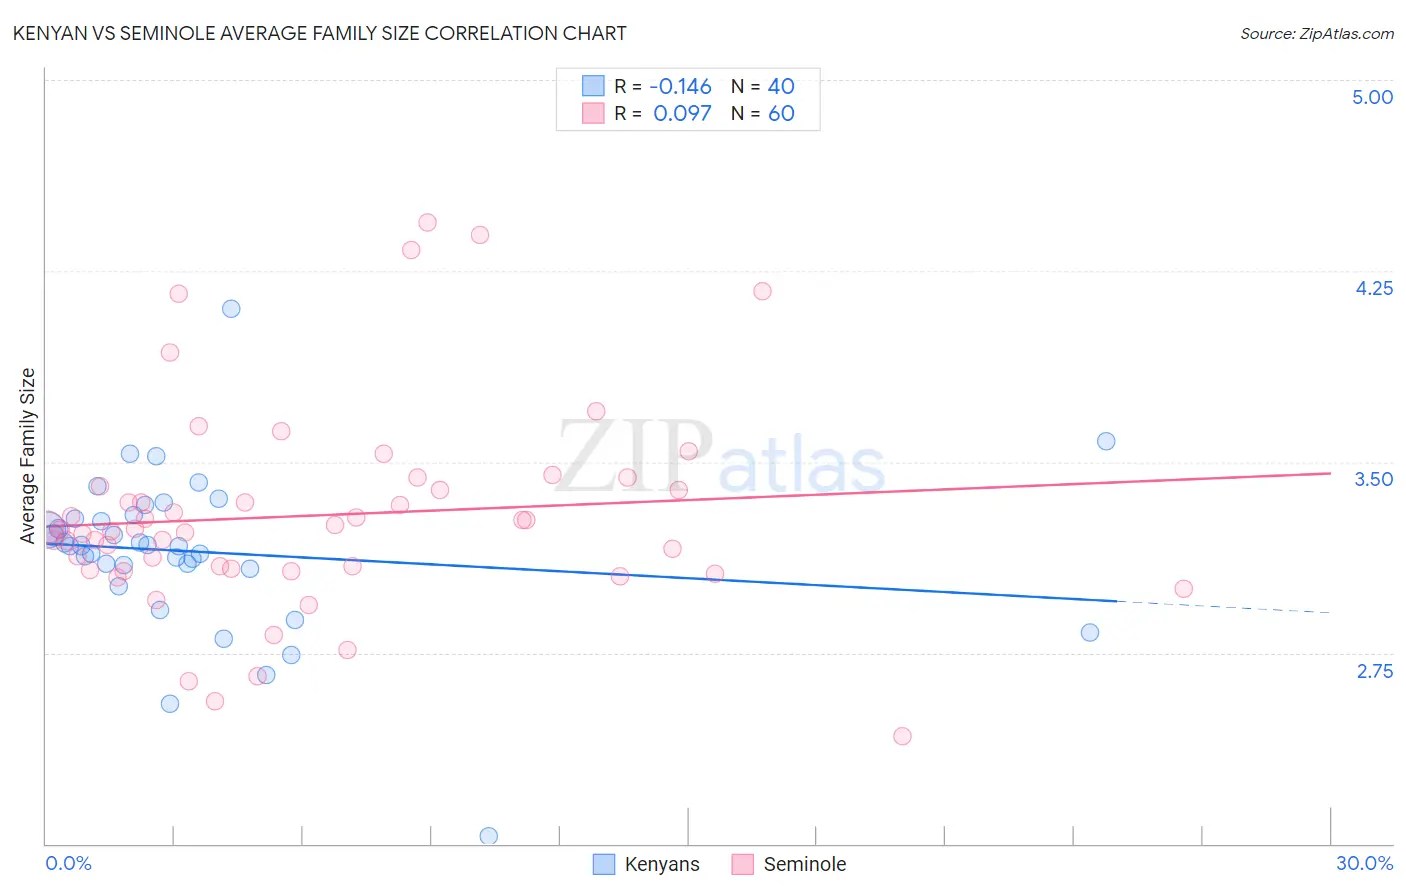
Kenyan vs Seminole Average Family Size Correlation Chart
The statistical analysis conducted on geographies consisting of 168,172,391 people shows a poor negative correlation between the proportion of Kenyans and average family size in the United States with a correlation coefficient (R) of -0.146 and weighted average of 3.21. Similarly, the statistical analysis conducted on geographies consisting of 118,298,481 people shows a slight positive correlation between the proportion of Seminole and average family size in the United States with a correlation coefficient (R) of 0.097 and weighted average of 3.24, a difference of 0.78%.
Average Family Size Correlation Summary
| Measurement | Kenyan | Seminole |
| Minimum | 2.03 | 2.42 |
| Maximum | 4.10 | 4.44 |
| Range | 2.07 | 2.02 |
| Mean | 3.15 | 3.29 |
| Median | 3.17 | 3.24 |
| Interquartile 25% (IQ1) | 3.09 | 3.08 |
| Interquartile 75% (IQ3) | 3.28 | 3.40 |
| Interquartile Range (IQR) | 0.20 | 0.32 |
| Standard Deviation (Sample) | 0.32 | 0.41 |
| Standard Deviation (Population) | 0.32 | 0.40 |
Similar Demographics by Average Family Size
Demographics Similar to Kenyans by Average Family Size
In terms of average family size, the demographic groups most similar to Kenyans are Senegalese (3.21, a difference of 0.0%), Choctaw (3.21, a difference of 0.010%), Immigrants from Sudan (3.22, a difference of 0.020%), Immigrants from Israel (3.22, a difference of 0.030%), and Immigrants from Zaire (3.22, a difference of 0.050%).
| Demographics | Rating | Rank | Average Family Size |
| Burmese | 31.0 /100 | #190 | Fair 3.22 |
| Immigrants | Zaire | 30.5 /100 | #191 | Fair 3.22 |
| Immigrants | Eastern Africa | 30.1 /100 | #192 | Fair 3.22 |
| Immigrants | Israel | 29.3 /100 | #193 | Fair 3.22 |
| Immigrants | Sudan | 29.1 /100 | #194 | Fair 3.22 |
| Choctaw | 28.3 /100 | #195 | Fair 3.21 |
| Senegalese | 28.2 /100 | #196 | Fair 3.21 |
| Kenyans | 28.0 /100 | #197 | Fair 3.21 |
| Immigrants | Azores | 21.7 /100 | #198 | Fair 3.21 |
| Hmong | 20.7 /100 | #199 | Fair 3.21 |
| Immigrants | Kenya | 19.2 /100 | #200 | Poor 3.21 |
| Immigrants | Morocco | 18.5 /100 | #201 | Poor 3.21 |
| Immigrants | India | 18.5 /100 | #202 | Poor 3.21 |
| Immigrants | Nepal | 18.1 /100 | #203 | Poor 3.21 |
| Immigrants | Poland | 16.6 /100 | #204 | Poor 3.20 |
Demographics Similar to Seminole by Average Family Size
In terms of average family size, the demographic groups most similar to Seminole are Immigrants from Taiwan (3.24, a difference of 0.0%), Immigrants from Uzbekistan (3.24, a difference of 0.020%), Immigrants from Egypt (3.24, a difference of 0.040%), Immigrants from Eritrea (3.24, a difference of 0.070%), and Iraqi (3.24, a difference of 0.080%).
| Demographics | Rating | Rank | Average Family Size |
| Blackfeet | 75.0 /100 | #148 | Good 3.24 |
| Assyrians/Chaldeans/Syriacs | 73.8 /100 | #149 | Good 3.24 |
| Indians (Asian) | 73.6 /100 | #150 | Good 3.24 |
| Jordanians | 73.5 /100 | #151 | Good 3.24 |
| Spanish Americans | 72.5 /100 | #152 | Good 3.24 |
| Immigrants | Eritrea | 71.4 /100 | #153 | Good 3.24 |
| Immigrants | Egypt | 70.0 /100 | #154 | Good 3.24 |
| Seminole | 68.2 /100 | #155 | Good 3.24 |
| Immigrants | Taiwan | 68.1 /100 | #156 | Good 3.24 |
| Immigrants | Uzbekistan | 67.0 /100 | #157 | Good 3.24 |
| Iraqis | 64.3 /100 | #158 | Good 3.24 |
| Ethiopians | 63.9 /100 | #159 | Good 3.24 |
| Immigrants | Iraq | 63.7 /100 | #160 | Good 3.24 |
| Immigrants | Chile | 63.2 /100 | #161 | Good 3.24 |
| Immigrants | Uganda | 60.1 /100 | #162 | Good 3.23 |