Immigrants from Nepal vs Seminole Disability Age 5 to 17
COMPARE
Immigrants from Nepal
Seminole
Disability Age 5 to 17
Disability Age 5 to 17 Comparison
Immigrants from Nepal
Seminole
5.5%
DISABILITY AGE 5 TO 17
77.1/ 100
METRIC RATING
158th/ 347
METRIC RANK
6.8%
DISABILITY AGE 5 TO 17
0.0/ 100
METRIC RATING
334th/ 347
METRIC RANK
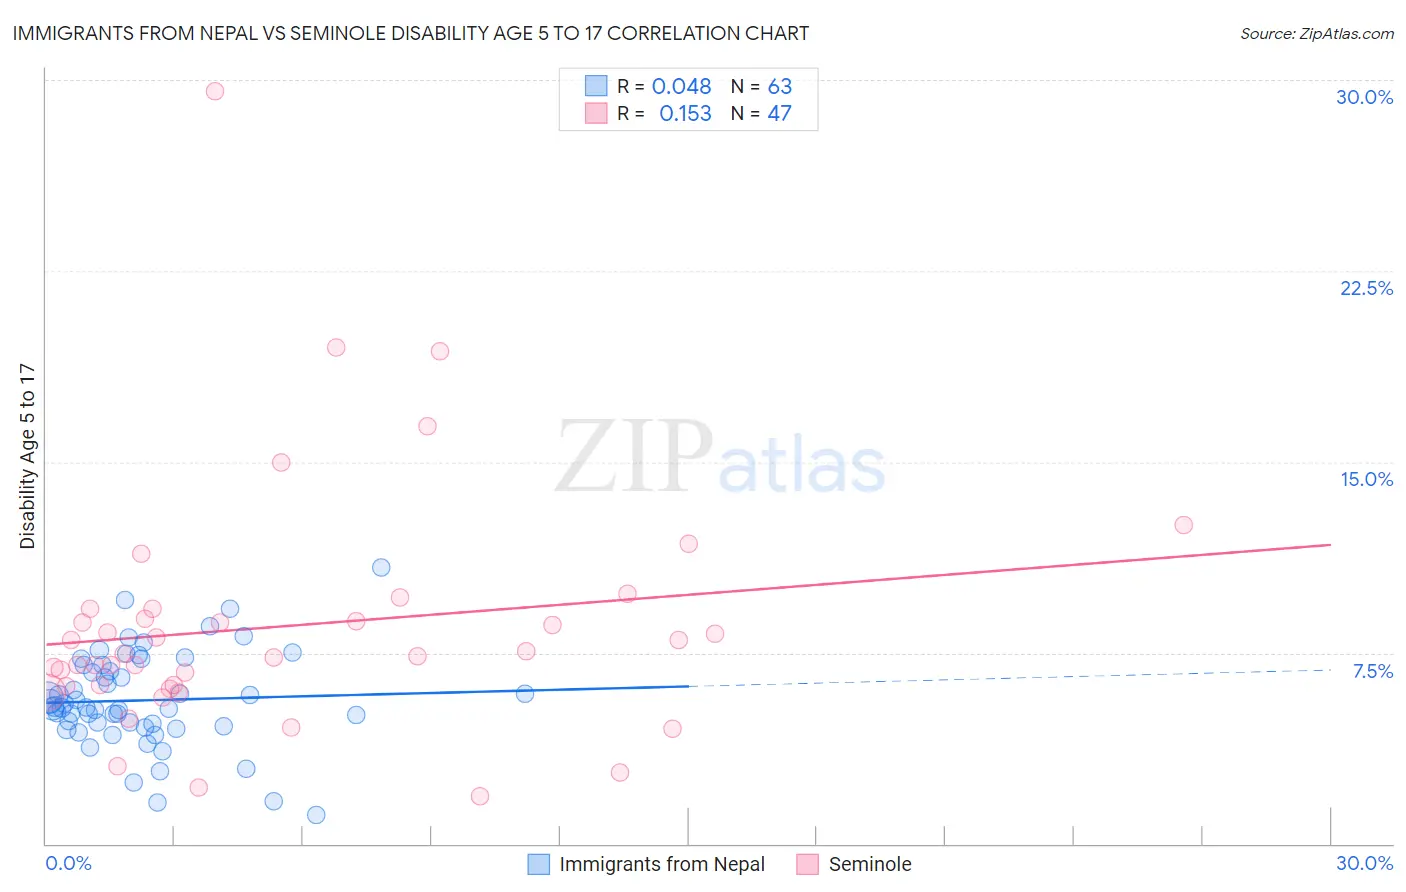
Immigrants from Nepal vs Seminole Disability Age 5 to 17 Correlation Chart
The statistical analysis conducted on geographies consisting of 186,213,470 people shows no correlation between the proportion of Immigrants from Nepal and percentage of population with a disability between the ages 5 and 17 in the United States with a correlation coefficient (R) of 0.048 and weighted average of 5.5%. Similarly, the statistical analysis conducted on geographies consisting of 117,971,284 people shows a poor positive correlation between the proportion of Seminole and percentage of population with a disability between the ages 5 and 17 in the United States with a correlation coefficient (R) of 0.153 and weighted average of 6.8%, a difference of 22.5%.
Disability Age 5 to 17 Correlation Summary
| Measurement | Immigrants from Nepal | Seminole |
| Minimum | 1.1% | 1.9% |
| Maximum | 10.9% | 29.5% |
| Range | 9.7% | 27.7% |
| Mean | 5.6% | 8.6% |
| Median | 5.4% | 7.5% |
| Interquartile 25% (IQ1) | 4.6% | 6.2% |
| Interquartile 75% (IQ3) | 7.0% | 9.2% |
| Interquartile Range (IQR) | 2.4% | 3.0% |
| Standard Deviation (Sample) | 1.9% | 4.8% |
| Standard Deviation (Population) | 1.9% | 4.8% |
Similar Demographics by Disability Age 5 to 17
Demographics Similar to Immigrants from Nepal by Disability Age 5 to 17
In terms of disability age 5 to 17, the demographic groups most similar to Immigrants from Nepal are Immigrants from Costa Rica (5.5%, a difference of 0.050%), Hawaiian (5.5%, a difference of 0.060%), Immigrants from Ecuador (5.5%, a difference of 0.080%), Australian (5.5%, a difference of 0.12%), and Immigrants from Zimbabwe (5.5%, a difference of 0.13%).
| Demographics | Rating | Rank | Disability Age 5 to 17 |
| Estonians | 80.8 /100 | #151 | Excellent 5.5% |
| Ute | 80.6 /100 | #152 | Excellent 5.5% |
| Ecuadorians | 79.7 /100 | #153 | Good 5.5% |
| Australians | 78.8 /100 | #154 | Good 5.5% |
| Immigrants | Ecuador | 78.3 /100 | #155 | Good 5.5% |
| Hawaiians | 78.0 /100 | #156 | Good 5.5% |
| Immigrants | Costa Rica | 77.9 /100 | #157 | Good 5.5% |
| Immigrants | Nepal | 77.1 /100 | #158 | Good 5.5% |
| Immigrants | Zimbabwe | 75.3 /100 | #159 | Good 5.5% |
| South Africans | 73.3 /100 | #160 | Good 5.5% |
| Immigrants | Saudi Arabia | 69.1 /100 | #161 | Good 5.5% |
| Zimbabweans | 67.2 /100 | #162 | Good 5.5% |
| Immigrants | Southern Europe | 64.0 /100 | #163 | Good 5.6% |
| Immigrants | Scotland | 61.9 /100 | #164 | Good 5.6% |
| Lebanese | 61.4 /100 | #165 | Good 5.6% |
Demographics Similar to Seminole by Disability Age 5 to 17
In terms of disability age 5 to 17, the demographic groups most similar to Seminole are Black/African American (6.8%, a difference of 0.050%), Immigrants from the Azores (6.7%, a difference of 0.64%), French Canadian (6.7%, a difference of 0.66%), Ottawa (6.8%, a difference of 0.70%), and Dutch West Indian (6.7%, a difference of 0.74%).
| Demographics | Rating | Rank | Disability Age 5 to 17 |
| French American Indians | 0.0 /100 | #327 | Tragic 6.6% |
| Pennsylvania Germans | 0.0 /100 | #328 | Tragic 6.6% |
| Blackfeet | 0.0 /100 | #329 | Tragic 6.6% |
| Dutch West Indians | 0.0 /100 | #330 | Tragic 6.7% |
| French Canadians | 0.0 /100 | #331 | Tragic 6.7% |
| Immigrants | Azores | 0.0 /100 | #332 | Tragic 6.7% |
| Blacks/African Americans | 0.0 /100 | #333 | Tragic 6.8% |
| Seminole | 0.0 /100 | #334 | Tragic 6.8% |
| Ottawa | 0.0 /100 | #335 | Tragic 6.8% |
| Chickasaw | 0.0 /100 | #336 | Tragic 6.8% |
| Creek | 0.0 /100 | #337 | Tragic 6.9% |
| Iroquois | 0.0 /100 | #338 | Tragic 6.9% |
| Choctaw | 0.0 /100 | #339 | Tragic 6.9% |
| Cherokee | 0.0 /100 | #340 | Tragic 6.9% |
| Cape Verdeans | 0.0 /100 | #341 | Tragic 7.0% |