British West Indian vs Seminole Disability Age 5 to 17
COMPARE
British West Indian
Seminole
Disability Age 5 to 17
Disability Age 5 to 17 Comparison
British West Indians
Seminole
5.8%
DISABILITY AGE 5 TO 17
5.4/ 100
METRIC RATING
226th/ 347
METRIC RANK
6.8%
DISABILITY AGE 5 TO 17
0.0/ 100
METRIC RATING
334th/ 347
METRIC RANK
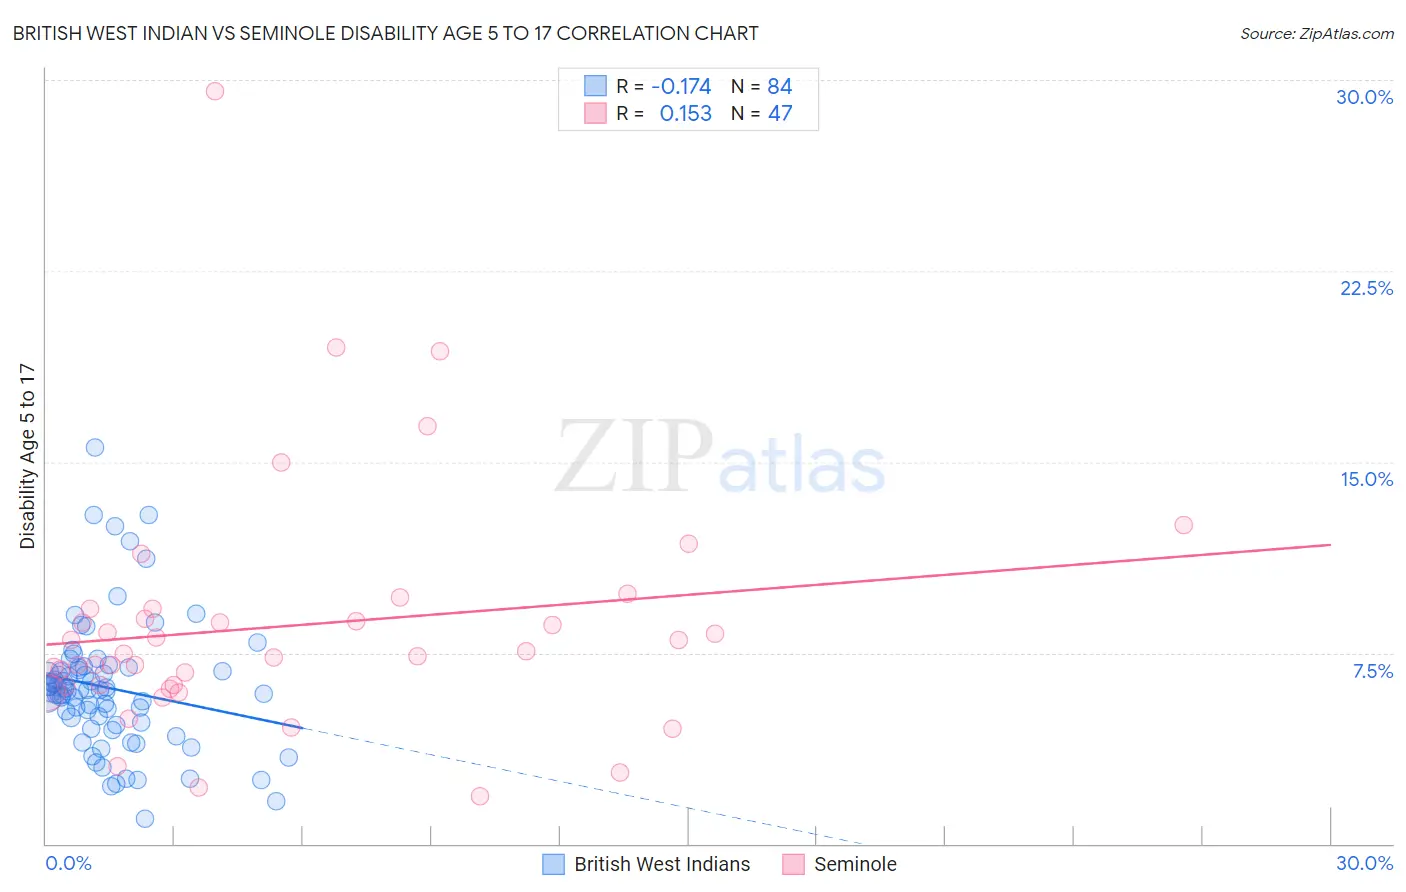
British West Indian vs Seminole Disability Age 5 to 17 Correlation Chart
The statistical analysis conducted on geographies consisting of 152,257,483 people shows a poor negative correlation between the proportion of British West Indians and percentage of population with a disability between the ages 5 and 17 in the United States with a correlation coefficient (R) of -0.174 and weighted average of 5.8%. Similarly, the statistical analysis conducted on geographies consisting of 117,971,284 people shows a poor positive correlation between the proportion of Seminole and percentage of population with a disability between the ages 5 and 17 in the United States with a correlation coefficient (R) of 0.153 and weighted average of 6.8%, a difference of 16.6%.
Disability Age 5 to 17 Correlation Summary
| Measurement | British West Indian | Seminole |
| Minimum | 1.0% | 1.9% |
| Maximum | 15.5% | 29.5% |
| Range | 14.5% | 27.7% |
| Mean | 6.1% | 8.6% |
| Median | 6.0% | 7.5% |
| Interquartile 25% (IQ1) | 4.7% | 6.2% |
| Interquartile 75% (IQ3) | 6.9% | 9.2% |
| Interquartile Range (IQR) | 2.2% | 3.0% |
| Standard Deviation (Sample) | 2.6% | 4.8% |
| Standard Deviation (Population) | 2.6% | 4.8% |
Similar Demographics by Disability Age 5 to 17
Demographics Similar to British West Indians by Disability Age 5 to 17
In terms of disability age 5 to 17, the demographic groups most similar to British West Indians are Guamanian/Chamorro (5.8%, a difference of 0.040%), Mexican (5.8%, a difference of 0.060%), Swiss (5.8%, a difference of 0.080%), Alsatian (5.8%, a difference of 0.12%), and Haitian (5.8%, a difference of 0.16%).
| Demographics | Rating | Rank | Disability Age 5 to 17 |
| Sierra Leoneans | 7.0 /100 | #219 | Tragic 5.8% |
| Belgians | 6.9 /100 | #220 | Tragic 5.8% |
| Lithuanians | 6.7 /100 | #221 | Tragic 5.8% |
| Immigrants | Sudan | 6.7 /100 | #222 | Tragic 5.8% |
| Alsatians | 6.0 /100 | #223 | Tragic 5.8% |
| Mexicans | 5.7 /100 | #224 | Tragic 5.8% |
| Guamanians/Chamorros | 5.6 /100 | #225 | Tragic 5.8% |
| British West Indians | 5.4 /100 | #226 | Tragic 5.8% |
| Swiss | 5.1 /100 | #227 | Tragic 5.8% |
| Haitians | 4.8 /100 | #228 | Tragic 5.8% |
| Bangladeshis | 4.8 /100 | #229 | Tragic 5.8% |
| Ghanaians | 4.7 /100 | #230 | Tragic 5.8% |
| Europeans | 4.5 /100 | #231 | Tragic 5.8% |
| Immigrants | Laos | 3.8 /100 | #232 | Tragic 5.8% |
| Immigrants | West Indies | 3.5 /100 | #233 | Tragic 5.8% |
Demographics Similar to Seminole by Disability Age 5 to 17
In terms of disability age 5 to 17, the demographic groups most similar to Seminole are Black/African American (6.8%, a difference of 0.050%), Immigrants from the Azores (6.7%, a difference of 0.64%), French Canadian (6.7%, a difference of 0.66%), Ottawa (6.8%, a difference of 0.70%), and Dutch West Indian (6.7%, a difference of 0.74%).
| Demographics | Rating | Rank | Disability Age 5 to 17 |
| French American Indians | 0.0 /100 | #327 | Tragic 6.6% |
| Pennsylvania Germans | 0.0 /100 | #328 | Tragic 6.6% |
| Blackfeet | 0.0 /100 | #329 | Tragic 6.6% |
| Dutch West Indians | 0.0 /100 | #330 | Tragic 6.7% |
| French Canadians | 0.0 /100 | #331 | Tragic 6.7% |
| Immigrants | Azores | 0.0 /100 | #332 | Tragic 6.7% |
| Blacks/African Americans | 0.0 /100 | #333 | Tragic 6.8% |
| Seminole | 0.0 /100 | #334 | Tragic 6.8% |
| Ottawa | 0.0 /100 | #335 | Tragic 6.8% |
| Chickasaw | 0.0 /100 | #336 | Tragic 6.8% |
| Creek | 0.0 /100 | #337 | Tragic 6.9% |
| Iroquois | 0.0 /100 | #338 | Tragic 6.9% |
| Choctaw | 0.0 /100 | #339 | Tragic 6.9% |
| Cherokee | 0.0 /100 | #340 | Tragic 6.9% |
| Cape Verdeans | 0.0 /100 | #341 | Tragic 7.0% |