Kenyan vs Uruguayan Disability Age 5 to 17
COMPARE
Kenyan
Uruguayan
Disability Age 5 to 17
Disability Age 5 to 17 Comparison
Kenyans
Uruguayans
5.8%
DISABILITY AGE 5 TO 17
10.0/ 100
METRIC RATING
208th/ 347
METRIC RANK
5.6%
DISABILITY AGE 5 TO 17
51.0/ 100
METRIC RATING
173rd/ 347
METRIC RANK
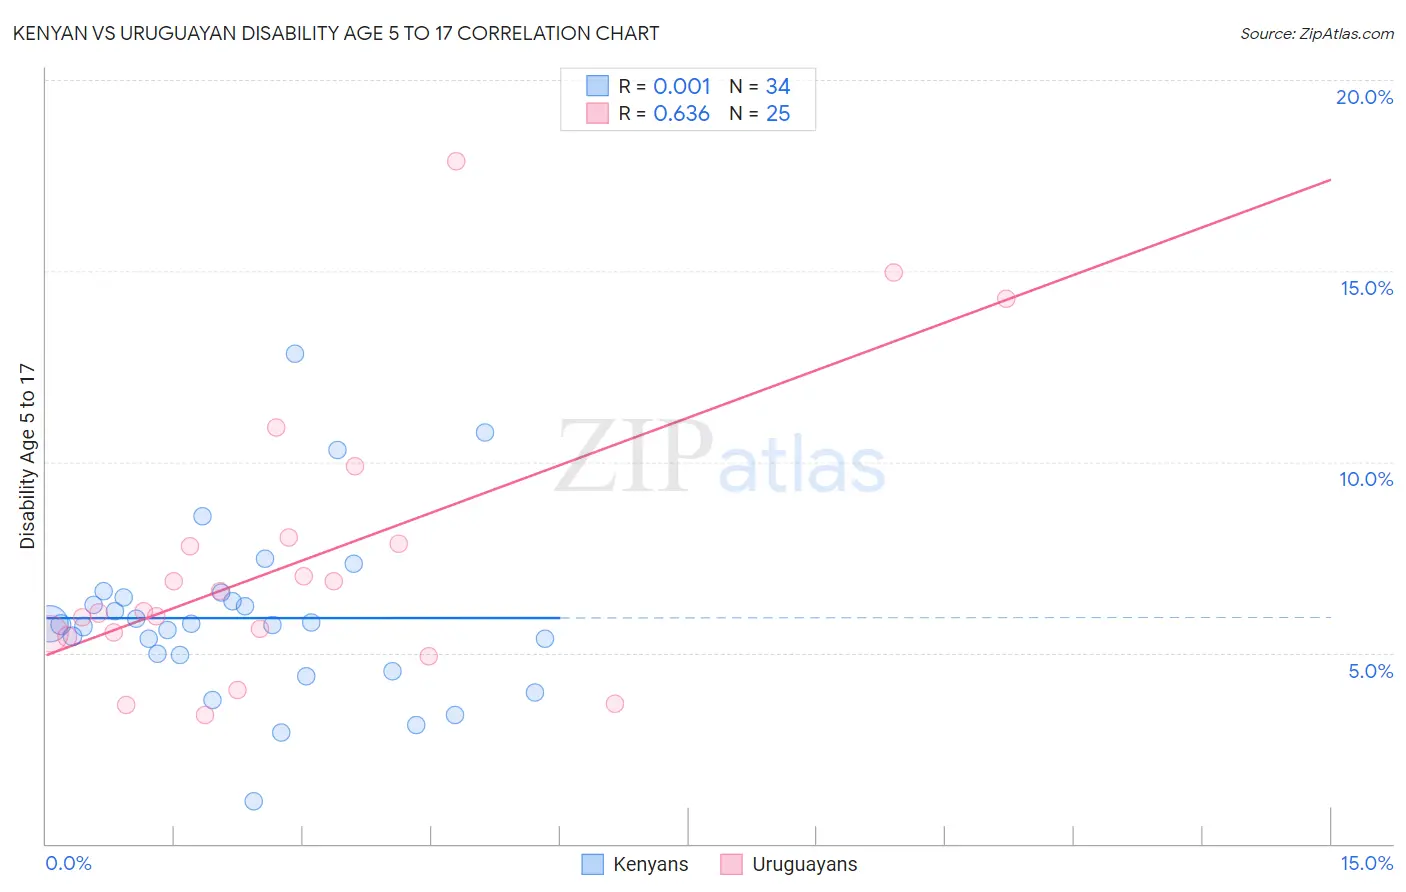
Kenyan vs Uruguayan Disability Age 5 to 17 Correlation Chart
The statistical analysis conducted on geographies consisting of 167,701,588 people shows no correlation between the proportion of Kenyans and percentage of population with a disability between the ages 5 and 17 in the United States with a correlation coefficient (R) of 0.001 and weighted average of 5.8%. Similarly, the statistical analysis conducted on geographies consisting of 144,432,233 people shows a significant positive correlation between the proportion of Uruguayans and percentage of population with a disability between the ages 5 and 17 in the United States with a correlation coefficient (R) of 0.636 and weighted average of 5.6%, a difference of 2.8%.
Disability Age 5 to 17 Correlation Summary
| Measurement | Kenyan | Uruguayan |
| Minimum | 1.1% | 3.4% |
| Maximum | 12.8% | 17.9% |
| Range | 11.7% | 14.5% |
| Mean | 5.9% | 7.4% |
| Median | 5.7% | 6.1% |
| Interquartile 25% (IQ1) | 5.0% | 5.5% |
| Interquartile 75% (IQ3) | 6.4% | 7.9% |
| Interquartile Range (IQR) | 1.5% | 2.5% |
| Standard Deviation (Sample) | 2.2% | 3.6% |
| Standard Deviation (Population) | 2.2% | 3.6% |
Similar Demographics by Disability Age 5 to 17
Demographics Similar to Kenyans by Disability Age 5 to 17
In terms of disability age 5 to 17, the demographic groups most similar to Kenyans are Immigrants from Uganda (5.8%, a difference of 0.040%), Moroccan (5.7%, a difference of 0.050%), Immigrants from Haiti (5.8%, a difference of 0.070%), Trinidadian and Tobagonian (5.7%, a difference of 0.10%), and Immigrants from Africa (5.7%, a difference of 0.10%).
| Demographics | Rating | Rank | Disability Age 5 to 17 |
| Basques | 13.7 /100 | #201 | Poor 5.7% |
| Austrians | 13.2 /100 | #202 | Poor 5.7% |
| Spanish American Indians | 12.8 /100 | #203 | Poor 5.7% |
| Paiute | 11.2 /100 | #204 | Poor 5.7% |
| Trinidadians and Tobagonians | 10.8 /100 | #205 | Poor 5.7% |
| Immigrants | Africa | 10.8 /100 | #206 | Poor 5.7% |
| Moroccans | 10.4 /100 | #207 | Poor 5.7% |
| Kenyans | 10.0 /100 | #208 | Poor 5.8% |
| Immigrants | Uganda | 9.7 /100 | #209 | Tragic 5.8% |
| Immigrants | Haiti | 9.5 /100 | #210 | Tragic 5.8% |
| Yugoslavians | 9.1 /100 | #211 | Tragic 5.8% |
| Immigrants | Panama | 8.7 /100 | #212 | Tragic 5.8% |
| Immigrants | Cameroon | 8.3 /100 | #213 | Tragic 5.8% |
| Immigrants | Morocco | 8.3 /100 | #214 | Tragic 5.8% |
| Swedes | 8.1 /100 | #215 | Tragic 5.8% |
Demographics Similar to Uruguayans by Disability Age 5 to 17
In terms of disability age 5 to 17, the demographic groups most similar to Uruguayans are Ukrainian (5.6%, a difference of 0.030%), Costa Rican (5.6%, a difference of 0.050%), Shoshone (5.6%, a difference of 0.080%), Immigrants from Central America (5.6%, a difference of 0.080%), and Serbian (5.6%, a difference of 0.15%).
| Demographics | Rating | Rank | Disability Age 5 to 17 |
| Greeks | 60.6 /100 | #166 | Good 5.6% |
| Immigrants | Burma/Myanmar | 59.3 /100 | #167 | Average 5.6% |
| Iraqis | 56.0 /100 | #168 | Average 5.6% |
| Immigrants | Norway | 55.7 /100 | #169 | Average 5.6% |
| Serbians | 54.0 /100 | #170 | Average 5.6% |
| Immigrants | Iraq | 53.9 /100 | #171 | Average 5.6% |
| Ukrainians | 51.5 /100 | #172 | Average 5.6% |
| Uruguayans | 51.0 /100 | #173 | Average 5.6% |
| Costa Ricans | 50.0 /100 | #174 | Average 5.6% |
| Shoshone | 49.4 /100 | #175 | Average 5.6% |
| Immigrants | Central America | 49.4 /100 | #176 | Average 5.6% |
| Immigrants | Western Europe | 47.8 /100 | #177 | Average 5.6% |
| Immigrants | Trinidad and Tobago | 47.6 /100 | #178 | Average 5.6% |
| Immigrants | Barbados | 40.5 /100 | #179 | Average 5.6% |
| Immigrants | Uruguay | 37.7 /100 | #180 | Fair 5.6% |