Immigrants from Japan vs Seminole Disability Age 5 to 17
COMPARE
Immigrants from Japan
Seminole
Disability Age 5 to 17
Disability Age 5 to 17 Comparison
Immigrants from Japan
Seminole
4.9%
DISABILITY AGE 5 TO 17
100.0/ 100
METRIC RATING
28th/ 347
METRIC RANK
6.8%
DISABILITY AGE 5 TO 17
0.0/ 100
METRIC RATING
334th/ 347
METRIC RANK
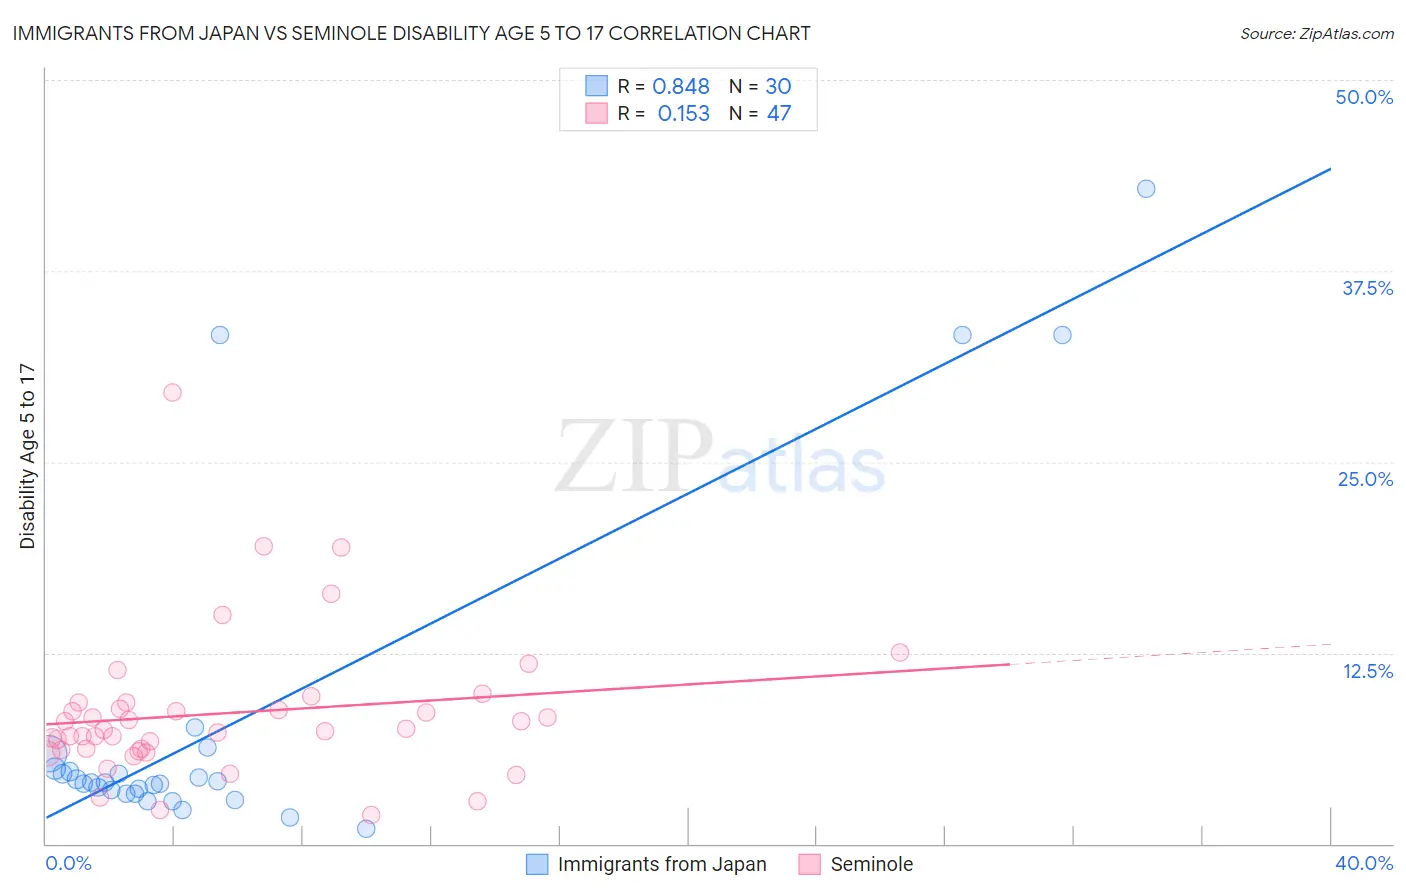
Immigrants from Japan vs Seminole Disability Age 5 to 17 Correlation Chart
The statistical analysis conducted on geographies consisting of 337,854,464 people shows a very strong positive correlation between the proportion of Immigrants from Japan and percentage of population with a disability between the ages 5 and 17 in the United States with a correlation coefficient (R) of 0.848 and weighted average of 4.9%. Similarly, the statistical analysis conducted on geographies consisting of 117,971,284 people shows a poor positive correlation between the proportion of Seminole and percentage of population with a disability between the ages 5 and 17 in the United States with a correlation coefficient (R) of 0.153 and weighted average of 6.8%, a difference of 37.3%.
Disability Age 5 to 17 Correlation Summary
| Measurement | Immigrants from Japan | Seminole |
| Minimum | 0.95% | 1.9% |
| Maximum | 42.9% | 29.5% |
| Range | 41.9% | 27.7% |
| Mean | 8.2% | 8.6% |
| Median | 4.0% | 7.5% |
| Interquartile 25% (IQ1) | 3.3% | 6.2% |
| Interquartile 75% (IQ3) | 4.9% | 9.2% |
| Interquartile Range (IQR) | 1.7% | 3.0% |
| Standard Deviation (Sample) | 11.2% | 4.8% |
| Standard Deviation (Population) | 11.0% | 4.8% |
Similar Demographics by Disability Age 5 to 17
Demographics Similar to Immigrants from Japan by Disability Age 5 to 17
In terms of disability age 5 to 17, the demographic groups most similar to Immigrants from Japan are Taiwanese (4.9%, a difference of 0.080%), Immigrants from Serbia (4.9%, a difference of 0.48%), Bhutanese (4.9%, a difference of 0.64%), Immigrants from Malaysia (5.0%, a difference of 0.70%), and Immigrants from Pakistan (5.0%, a difference of 0.95%).
| Demographics | Rating | Rank | Disability Age 5 to 17 |
| Yup'ik | 100.0 /100 | #21 | Exceptional 4.8% |
| Asians | 100.0 /100 | #22 | Exceptional 4.8% |
| Immigrants | Bolivia | 100.0 /100 | #23 | Exceptional 4.8% |
| Immigrants | Lebanon | 100.0 /100 | #24 | Exceptional 4.8% |
| Immigrants | Asia | 100.0 /100 | #25 | Exceptional 4.8% |
| Bhutanese | 100.0 /100 | #26 | Exceptional 4.9% |
| Taiwanese | 100.0 /100 | #27 | Exceptional 4.9% |
| Immigrants | Japan | 100.0 /100 | #28 | Exceptional 4.9% |
| Immigrants | Serbia | 100.0 /100 | #29 | Exceptional 4.9% |
| Immigrants | Malaysia | 100.0 /100 | #30 | Exceptional 5.0% |
| Immigrants | Pakistan | 100.0 /100 | #31 | Exceptional 5.0% |
| Soviet Union | 100.0 /100 | #32 | Exceptional 5.0% |
| Immigrants | Indonesia | 100.0 /100 | #33 | Exceptional 5.0% |
| Israelis | 100.0 /100 | #34 | Exceptional 5.0% |
| Bolivians | 100.0 /100 | #35 | Exceptional 5.0% |
Demographics Similar to Seminole by Disability Age 5 to 17
In terms of disability age 5 to 17, the demographic groups most similar to Seminole are Black/African American (6.8%, a difference of 0.050%), Immigrants from the Azores (6.7%, a difference of 0.64%), French Canadian (6.7%, a difference of 0.66%), Ottawa (6.8%, a difference of 0.70%), and Dutch West Indian (6.7%, a difference of 0.74%).
| Demographics | Rating | Rank | Disability Age 5 to 17 |
| French American Indians | 0.0 /100 | #327 | Tragic 6.6% |
| Pennsylvania Germans | 0.0 /100 | #328 | Tragic 6.6% |
| Blackfeet | 0.0 /100 | #329 | Tragic 6.6% |
| Dutch West Indians | 0.0 /100 | #330 | Tragic 6.7% |
| French Canadians | 0.0 /100 | #331 | Tragic 6.7% |
| Immigrants | Azores | 0.0 /100 | #332 | Tragic 6.7% |
| Blacks/African Americans | 0.0 /100 | #333 | Tragic 6.8% |
| Seminole | 0.0 /100 | #334 | Tragic 6.8% |
| Ottawa | 0.0 /100 | #335 | Tragic 6.8% |
| Chickasaw | 0.0 /100 | #336 | Tragic 6.8% |
| Creek | 0.0 /100 | #337 | Tragic 6.9% |
| Iroquois | 0.0 /100 | #338 | Tragic 6.9% |
| Choctaw | 0.0 /100 | #339 | Tragic 6.9% |
| Cherokee | 0.0 /100 | #340 | Tragic 6.9% |
| Cape Verdeans | 0.0 /100 | #341 | Tragic 7.0% |