Japanese vs Albanian Disability Age 5 to 17
COMPARE
Japanese
Albanian
Disability Age 5 to 17
Disability Age 5 to 17 Comparison
Japanese
Albanians
6.1%
DISABILITY AGE 5 TO 17
0.1/ 100
METRIC RATING
276th/ 347
METRIC RANK
5.5%
DISABILITY AGE 5 TO 17
83.7/ 100
METRIC RATING
146th/ 347
METRIC RANK
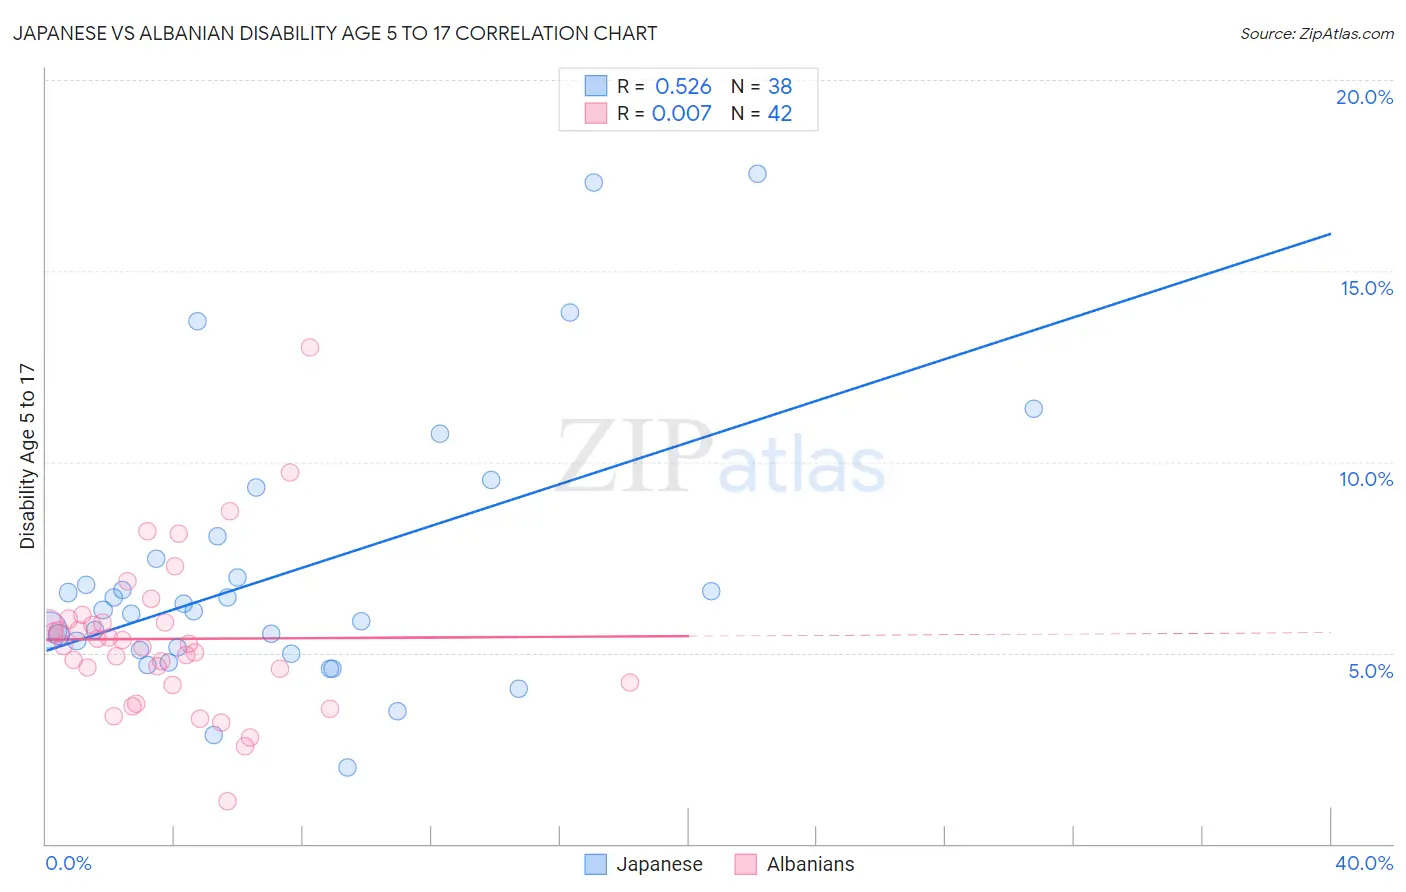
Japanese vs Albanian Disability Age 5 to 17 Correlation Chart
The statistical analysis conducted on geographies consisting of 248,392,506 people shows a substantial positive correlation between the proportion of Japanese and percentage of population with a disability between the ages 5 and 17 in the United States with a correlation coefficient (R) of 0.526 and weighted average of 6.1%. Similarly, the statistical analysis conducted on geographies consisting of 192,377,953 people shows no correlation between the proportion of Albanians and percentage of population with a disability between the ages 5 and 17 in the United States with a correlation coefficient (R) of 0.007 and weighted average of 5.5%, a difference of 10.3%.
Disability Age 5 to 17 Correlation Summary
| Measurement | Japanese | Albanian |
| Minimum | 2.0% | 1.1% |
| Maximum | 17.6% | 13.0% |
| Range | 15.6% | 11.9% |
| Mean | 7.1% | 5.4% |
| Median | 6.1% | 5.2% |
| Interquartile 25% (IQ1) | 5.1% | 4.2% |
| Interquartile 75% (IQ3) | 7.5% | 5.8% |
| Interquartile Range (IQR) | 2.4% | 1.6% |
| Standard Deviation (Sample) | 3.6% | 2.1% |
| Standard Deviation (Population) | 3.5% | 2.0% |
Similar Demographics by Disability Age 5 to 17
Demographics Similar to Japanese by Disability Age 5 to 17
In terms of disability age 5 to 17, the demographic groups most similar to Japanese are Dutch (6.0%, a difference of 0.11%), Cheyenne (6.0%, a difference of 0.21%), Alaska Native (6.0%, a difference of 0.33%), Finnish (6.0%, a difference of 0.38%), and Immigrants from Zaire (6.0%, a difference of 0.40%).
| Demographics | Rating | Rank | Disability Age 5 to 17 |
| Liberians | 0.4 /100 | #269 | Tragic 6.0% |
| Immigrants | Somalia | 0.4 /100 | #270 | Tragic 6.0% |
| Immigrants | Zaire | 0.2 /100 | #271 | Tragic 6.0% |
| Finns | 0.2 /100 | #272 | Tragic 6.0% |
| Alaska Natives | 0.2 /100 | #273 | Tragic 6.0% |
| Cheyenne | 0.2 /100 | #274 | Tragic 6.0% |
| Dutch | 0.2 /100 | #275 | Tragic 6.0% |
| Japanese | 0.1 /100 | #276 | Tragic 6.1% |
| Puget Sound Salish | 0.1 /100 | #277 | Tragic 6.1% |
| Immigrants | Liberia | 0.1 /100 | #278 | Tragic 6.1% |
| Immigrants | Jamaica | 0.1 /100 | #279 | Tragic 6.1% |
| Portuguese | 0.1 /100 | #280 | Tragic 6.1% |
| Scottish | 0.0 /100 | #281 | Tragic 6.1% |
| Germans | 0.0 /100 | #282 | Tragic 6.1% |
| Ugandans | 0.0 /100 | #283 | Tragic 6.2% |
Demographics Similar to Albanians by Disability Age 5 to 17
In terms of disability age 5 to 17, the demographic groups most similar to Albanians are Immigrants from Albania (5.5%, a difference of 0.060%), Samoan (5.5%, a difference of 0.16%), Central American (5.5%, a difference of 0.19%), Guatemalan (5.5%, a difference of 0.19%), and Estonian (5.5%, a difference of 0.26%).
| Demographics | Rating | Rank | Disability Age 5 to 17 |
| Belizeans | 90.8 /100 | #139 | Exceptional 5.4% |
| Immigrants | Netherlands | 90.5 /100 | #140 | Exceptional 5.4% |
| South American Indians | 89.3 /100 | #141 | Excellent 5.5% |
| Colombians | 88.0 /100 | #142 | Excellent 5.5% |
| Immigrants | Hungary | 87.9 /100 | #143 | Excellent 5.5% |
| Pakistanis | 87.3 /100 | #144 | Excellent 5.5% |
| Immigrants | Guatemala | 86.6 /100 | #145 | Excellent 5.5% |
| Albanians | 83.7 /100 | #146 | Excellent 5.5% |
| Immigrants | Albania | 83.1 /100 | #147 | Excellent 5.5% |
| Samoans | 81.9 /100 | #148 | Excellent 5.5% |
| Central Americans | 81.6 /100 | #149 | Excellent 5.5% |
| Guatemalans | 81.5 /100 | #150 | Excellent 5.5% |
| Estonians | 80.8 /100 | #151 | Excellent 5.5% |
| Ute | 80.6 /100 | #152 | Excellent 5.5% |
| Ecuadorians | 79.7 /100 | #153 | Good 5.5% |