Japanese vs New Zealander Disability Age 5 to 17
COMPARE
Japanese
New Zealander
Disability Age 5 to 17
Disability Age 5 to 17 Comparison
Japanese
New Zealanders
6.1%
DISABILITY AGE 5 TO 17
0.1/ 100
METRIC RATING
276th/ 347
METRIC RANK
5.4%
DISABILITY AGE 5 TO 17
95.0/ 100
METRIC RATING
126th/ 347
METRIC RANK
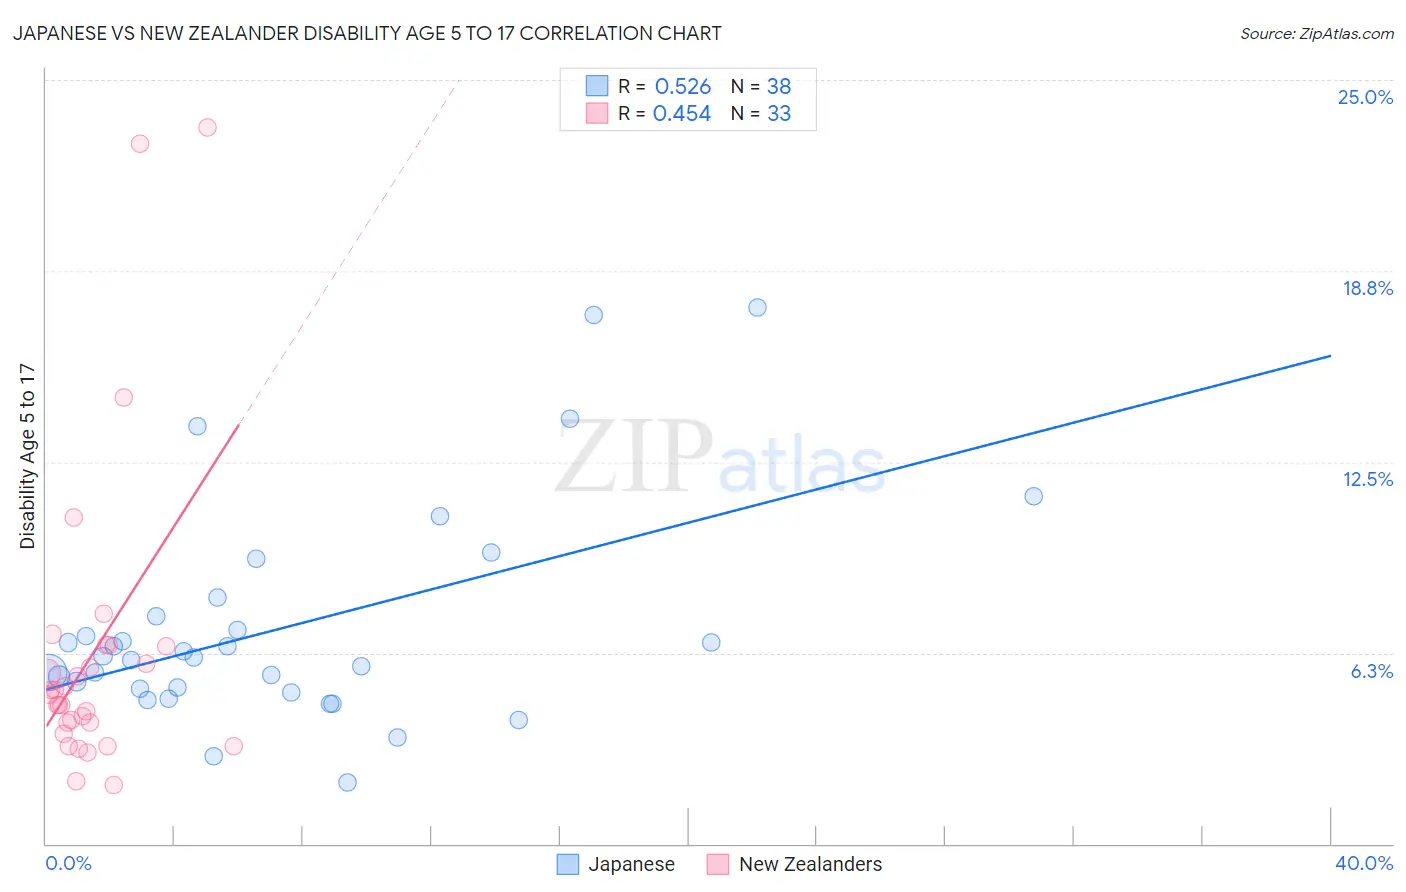
Japanese vs New Zealander Disability Age 5 to 17 Correlation Chart
The statistical analysis conducted on geographies consisting of 248,392,506 people shows a substantial positive correlation between the proportion of Japanese and percentage of population with a disability between the ages 5 and 17 in the United States with a correlation coefficient (R) of 0.526 and weighted average of 6.1%. Similarly, the statistical analysis conducted on geographies consisting of 106,604,029 people shows a moderate positive correlation between the proportion of New Zealanders and percentage of population with a disability between the ages 5 and 17 in the United States with a correlation coefficient (R) of 0.454 and weighted average of 5.4%, a difference of 12.1%.
Disability Age 5 to 17 Correlation Summary
| Measurement | Japanese | New Zealander |
| Minimum | 2.0% | 1.9% |
| Maximum | 17.6% | 23.4% |
| Range | 15.6% | 21.5% |
| Mean | 7.1% | 6.2% |
| Median | 6.1% | 4.9% |
| Interquartile 25% (IQ1) | 5.1% | 3.8% |
| Interquartile 75% (IQ3) | 7.5% | 6.5% |
| Interquartile Range (IQR) | 2.4% | 2.7% |
| Standard Deviation (Sample) | 3.6% | 5.0% |
| Standard Deviation (Population) | 3.5% | 4.9% |
Similar Demographics by Disability Age 5 to 17
Demographics Similar to Japanese by Disability Age 5 to 17
In terms of disability age 5 to 17, the demographic groups most similar to Japanese are Dutch (6.0%, a difference of 0.11%), Cheyenne (6.0%, a difference of 0.21%), Alaska Native (6.0%, a difference of 0.33%), Finnish (6.0%, a difference of 0.38%), and Immigrants from Zaire (6.0%, a difference of 0.40%).
| Demographics | Rating | Rank | Disability Age 5 to 17 |
| Liberians | 0.4 /100 | #269 | Tragic 6.0% |
| Immigrants | Somalia | 0.4 /100 | #270 | Tragic 6.0% |
| Immigrants | Zaire | 0.2 /100 | #271 | Tragic 6.0% |
| Finns | 0.2 /100 | #272 | Tragic 6.0% |
| Alaska Natives | 0.2 /100 | #273 | Tragic 6.0% |
| Cheyenne | 0.2 /100 | #274 | Tragic 6.0% |
| Dutch | 0.2 /100 | #275 | Tragic 6.0% |
| Japanese | 0.1 /100 | #276 | Tragic 6.1% |
| Puget Sound Salish | 0.1 /100 | #277 | Tragic 6.1% |
| Immigrants | Liberia | 0.1 /100 | #278 | Tragic 6.1% |
| Immigrants | Jamaica | 0.1 /100 | #279 | Tragic 6.1% |
| Portuguese | 0.1 /100 | #280 | Tragic 6.1% |
| Scottish | 0.0 /100 | #281 | Tragic 6.1% |
| Germans | 0.0 /100 | #282 | Tragic 6.1% |
| Ugandans | 0.0 /100 | #283 | Tragic 6.2% |
Demographics Similar to New Zealanders by Disability Age 5 to 17
In terms of disability age 5 to 17, the demographic groups most similar to New Zealanders are Latvian (5.4%, a difference of 0.0%), Immigrants from Chile (5.4%, a difference of 0.010%), Crow (5.4%, a difference of 0.020%), Immigrants from Venezuela (5.4%, a difference of 0.12%), and Immigrants from Ethiopia (5.4%, a difference of 0.16%).
| Demographics | Rating | Rank | Disability Age 5 to 17 |
| Immigrants | South America | 97.1 /100 | #119 | Exceptional 5.4% |
| Immigrants | Immigrants | 97.0 /100 | #120 | Exceptional 5.4% |
| Maltese | 96.0 /100 | #121 | Exceptional 5.4% |
| Chileans | 95.8 /100 | #122 | Exceptional 5.4% |
| Immigrants | Ethiopia | 95.5 /100 | #123 | Exceptional 5.4% |
| Crow | 95.0 /100 | #124 | Exceptional 5.4% |
| Immigrants | Chile | 95.0 /100 | #125 | Exceptional 5.4% |
| New Zealanders | 95.0 /100 | #126 | Exceptional 5.4% |
| Latvians | 95.0 /100 | #127 | Exceptional 5.4% |
| Immigrants | Venezuela | 94.5 /100 | #128 | Exceptional 5.4% |
| Romanians | 94.1 /100 | #129 | Exceptional 5.4% |
| Immigrants | Bulgaria | 94.0 /100 | #130 | Exceptional 5.4% |
| Arabs | 92.9 /100 | #131 | Exceptional 5.4% |
| Immigrants | Colombia | 92.9 /100 | #132 | Exceptional 5.4% |
| Venezuelans | 92.7 /100 | #133 | Exceptional 5.4% |