Italian vs Immigrants from Sudan Master's Degree
COMPARE
Italian
Immigrants from Sudan
Master's Degree
Master's Degree Comparison
Italians
Immigrants from Sudan
16.4%
MASTER'S DEGREE
95.4/ 100
METRIC RATING
125th/ 347
METRIC RANK
16.0%
MASTER'S DEGREE
90.2/ 100
METRIC RATING
133rd/ 347
METRIC RANK
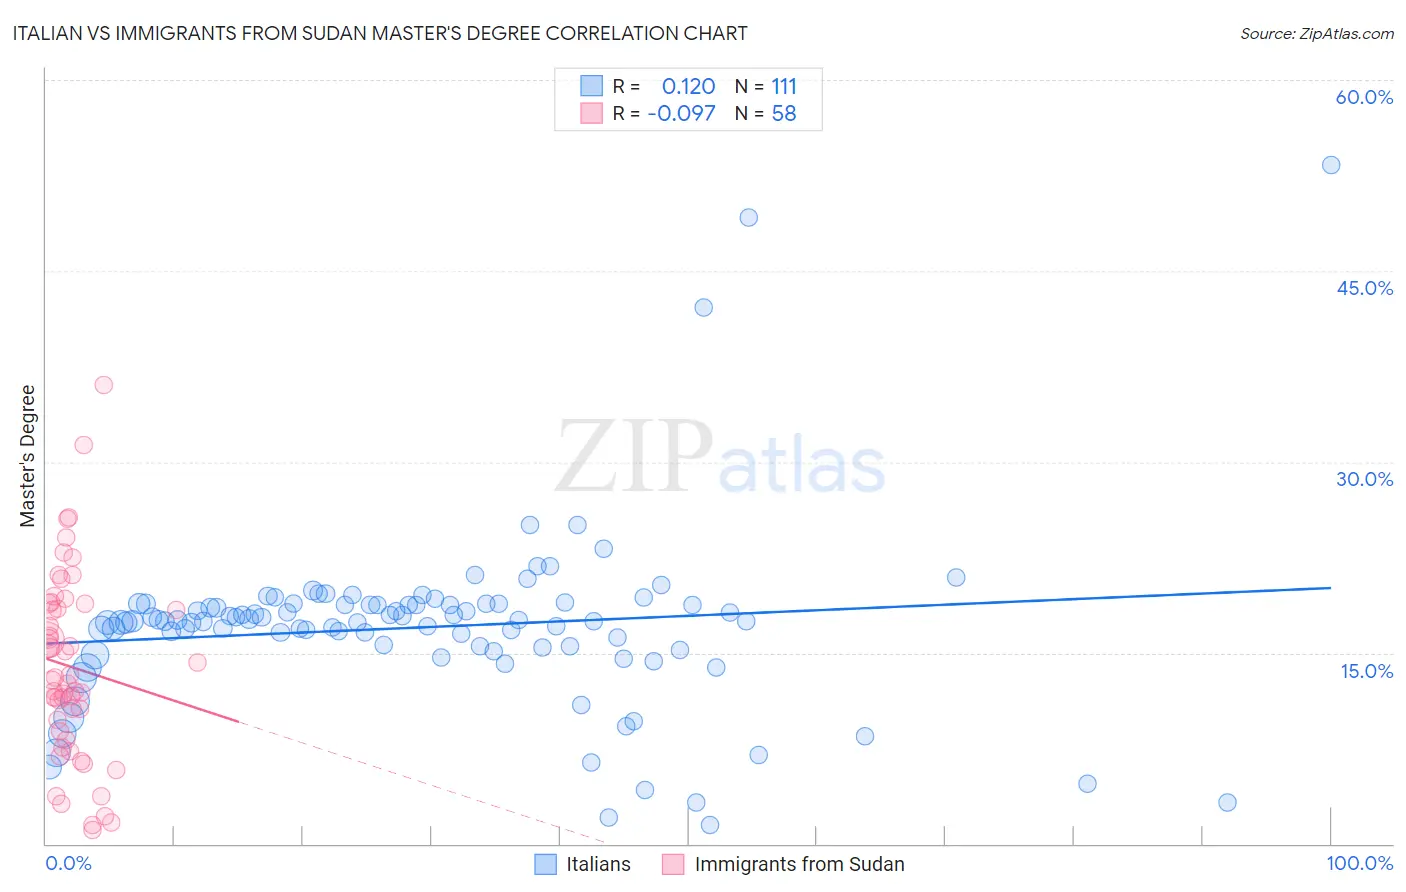
Italian vs Immigrants from Sudan Master's Degree Correlation Chart
The statistical analysis conducted on geographies consisting of 574,113,330 people shows a poor positive correlation between the proportion of Italians and percentage of population with at least master's degree education in the United States with a correlation coefficient (R) of 0.120 and weighted average of 16.4%. Similarly, the statistical analysis conducted on geographies consisting of 118,960,679 people shows a slight negative correlation between the proportion of Immigrants from Sudan and percentage of population with at least master's degree education in the United States with a correlation coefficient (R) of -0.097 and weighted average of 16.0%, a difference of 2.4%.
Master's Degree Correlation Summary
| Measurement | Italian | Immigrants from Sudan |
| Minimum | 1.5% | 1.0% |
| Maximum | 53.3% | 36.1% |
| Range | 51.8% | 35.0% |
| Mean | 17.0% | 13.9% |
| Median | 17.5% | 13.0% |
| Interquartile 25% (IQ1) | 15.4% | 8.8% |
| Interquartile 75% (IQ3) | 18.8% | 18.8% |
| Interquartile Range (IQR) | 3.4% | 10.0% |
| Standard Deviation (Sample) | 7.0% | 7.4% |
| Standard Deviation (Population) | 7.0% | 7.3% |
Demographics Similar to Italians and Immigrants from Sudan by Master's Degree
In terms of master's degree, the demographic groups most similar to Italians are Immigrants from Eritrea (16.4%, a difference of 0.070%), Immigrants from Eastern Africa (16.3%, a difference of 0.11%), Croatian (16.4%, a difference of 0.14%), British (16.4%, a difference of 0.16%), and Palestinian (16.3%, a difference of 0.37%). Similarly, the demographic groups most similar to Immigrants from Sudan are Serbian (16.1%, a difference of 0.54%), Venezuelan (15.9%, a difference of 0.56%), South American Indian (15.9%, a difference of 0.56%), Taiwanese (16.1%, a difference of 0.63%), and Immigrants from Jordan (16.1%, a difference of 0.95%).
| Demographics | Rating | Rank | Master's Degree |
| Jordanians | 96.5 /100 | #119 | Exceptional 16.5% |
| Lebanese | 96.4 /100 | #120 | Exceptional 16.5% |
| Afghans | 96.2 /100 | #121 | Exceptional 16.5% |
| British | 95.6 /100 | #122 | Exceptional 16.4% |
| Croatians | 95.6 /100 | #123 | Exceptional 16.4% |
| Immigrants | Eritrea | 95.5 /100 | #124 | Exceptional 16.4% |
| Italians | 95.4 /100 | #125 | Exceptional 16.4% |
| Immigrants | Eastern Africa | 95.2 /100 | #126 | Exceptional 16.3% |
| Palestinians | 94.8 /100 | #127 | Exceptional 16.3% |
| Immigrants | Sierra Leone | 94.7 /100 | #128 | Exceptional 16.3% |
| Immigrants | Syria | 93.3 /100 | #129 | Exceptional 16.2% |
| Immigrants | Jordan | 92.7 /100 | #130 | Exceptional 16.1% |
| Taiwanese | 91.9 /100 | #131 | Exceptional 16.1% |
| Serbians | 91.7 /100 | #132 | Exceptional 16.1% |
| Immigrants | Sudan | 90.2 /100 | #133 | Exceptional 16.0% |
| Venezuelans | 88.4 /100 | #134 | Excellent 15.9% |
| South American Indians | 88.4 /100 | #135 | Excellent 15.9% |
| Assyrians/Chaldeans/Syriacs | 86.8 /100 | #136 | Excellent 15.8% |
| Europeans | 86.4 /100 | #137 | Excellent 15.8% |
| Pakistanis | 86.1 /100 | #138 | Excellent 15.8% |
| Immigrants | Germany | 85.9 /100 | #139 | Excellent 15.8% |